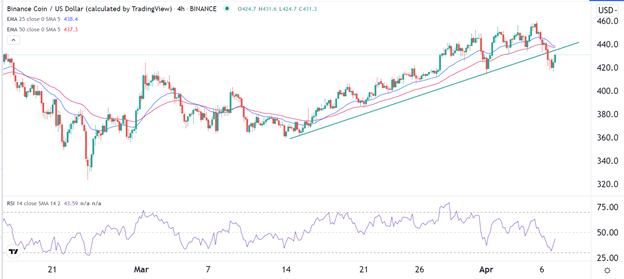
The coin will likely resume the bearish trend as it forms a break and retest pattern.
Bearish View
- Set a buy-limit at $440 and a take-profit at $400.
- Add a stop-loss at $500.
- Timeline: 1-2 days.
Bullish View
- Set a buy-stop at $450 and a take-price at $550.
- Add a stop-loss at $400.
The BNB coin price is crawling back after it plummeted to the lowest point since April 1 during the overnight session. The BNB/USD pair is trading at 430, which is a few points above its lowest level this week.
BNB Crawls Back
BNB is the native token for the BNB Chain, which was formerly known as Binance Smart Chain. It is also widely used to handle transactions in the Binance ecosystem.
BNB Chain is a well-developed ecosystem that enables developers to build high-performing decentralized applications. For example, it has been used to build top applications like Venus and PancakeSwap.
In the past few months, the BNB price has been struggling as competition in the industry has increased. For example, it has already been overtaken by Terra in terms of total value locked (TVL). It has a TVL of about $13 billion, which is lower than its all-time high of about $20 billion.
Terra, on the other hand, has a TVL of about $30 billion. At the same time, other chains like Avalanche and Cronos are catching up to the platform. This performance is mostly because these other chains offer a better and faster platform than BNB. It can handle less than 50 transactions per second (TPS) while the others can handle more than 1,000.
The BNB/USD is also rising after Binance.us raised millions of dollars and boosted its valuation to more than $4 billion. The company is affiliated with the main Binance, with the only difference being that it is regulated by American regulators.
Its price declined sharply in the overnight session after the FOMC minutes showed that officials were concerned about inflation and were comfortable with more rate hikes. They also hinted that they will start quantitative tightening in May.
BNB Price Prediction
The BNB price has been in a strong bearish trend in the past few days. In this period, the coin fell from last month’s high of $459 to a low of $417. The coin is attempting to retest the ascending trendline that is shown in green. At the same time, the 25-day and 50-day exponential moving averages (EMA) have made a bearish crossover pattern.
Therefore, the coin will likely resume the bearish trend as it forms a break and retest pattern. Therefore, the coin will likely retest the support at $400.


