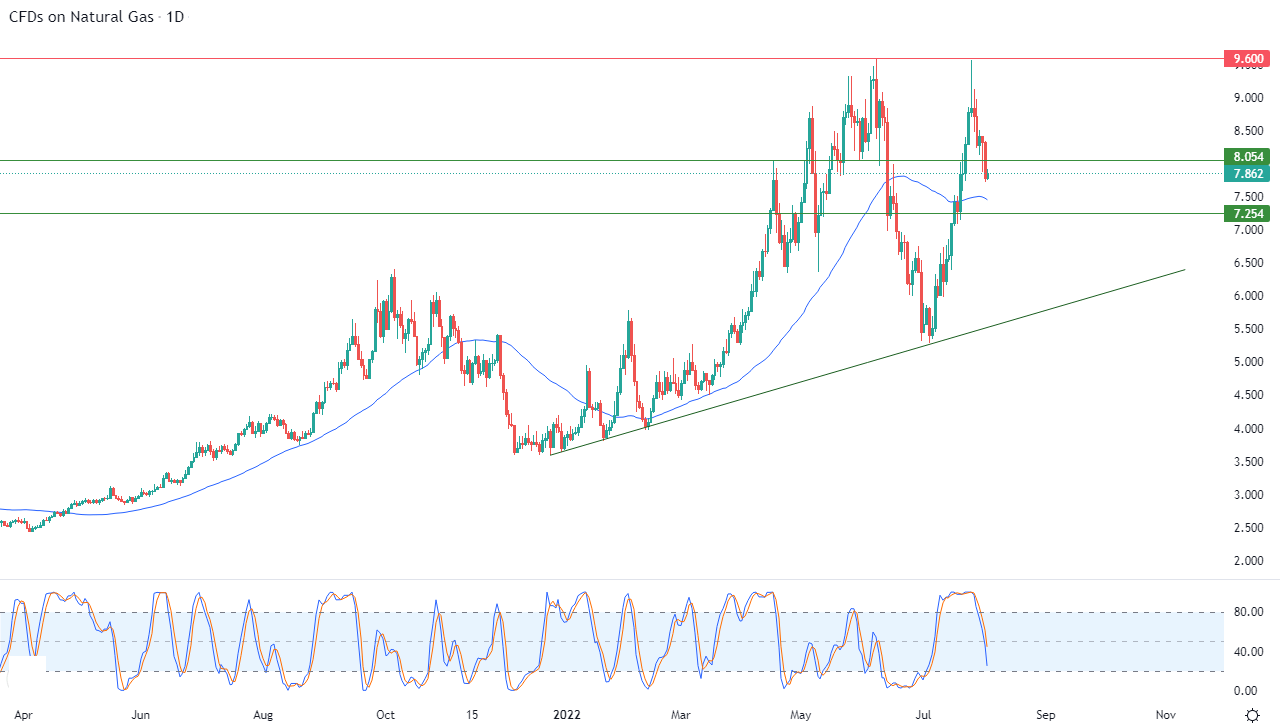
Spot natural gas prices (CFDS ON NATURAL GAS) stabilized at a decrease in the recent trading at the intraday levels, to achieve slight daily gains until the moment of writing this report, by 0.94%. It settled at the price of $7.851 per million British thermal units, after falling sharply during trading. Yesterday, the rate was -6.65%.
Natural gas prices extended their losses yesterday, in part due to the weather forecast for the second half of August, which shows milder temperatures in the East, Midwest and part of the southwest US, this may reduce gas demand in the energy sector and ease market pressure.
How does weather affect Natural Gas?
The weather forecast also remains optimistic with NOAA’s 6- to 10-day forecast showing hotter-than-normal conditions across the entire US except for part of the Southwest.
September gas futures contracts on Nymex were down 57.7 cents at $7.706 per million British thermal units. While the futures contract for the month of October in the Nymex fell 56.2 cents to $ 7,698.
While spot gas prices extended NGI’s Spot Gas National Avg even as temperatures soared across much of the United States, an estimated loss of 33.0 cents to $7,810.
Meanwhile, Russian President Vladimir Putin said the West launched an economic war aimed at destroying Russia and its economy and promised to sell Russia’s vast energy resources to countries in Asia like China if European customers didn’t want to buy them.
Kremlin-controlled Gazprom has reduced flows through Nord Stream 1, the largest single pipeline carrying Russian gas to Germany, to 20% of capacity due to what it describes as defective equipment, notably a delayed return of the SGT-A65 turbine.
Germany has said the turbines are an excuse and that Moscow is using gas as a political weapon, and German Economy Minister Robert Habeck said last month: “They don’t have the courage to say, ‘We are in an economic war with you’.”
Natural Gas Technical Outlook
Technically, natural gas broke yesterday the current support level of 8.054, as part of its attempt to search for a bullish bottom. It can take it as a base that might help it gain the necessary positive momentum to regain its recovery, amid the negative signals on the relative strength indicators. This is in front of the dominance of the main bullish trend in the medium term and its trading along the line of a minor bullish slope. This is shown in the attached chart for a period of time (daily), with the continuation of the positive support for its trading above its simple moving average for the previous 50 days.
Therefore, we expect more corrective decline for natural gas during its upcoming trading, as long as it remains below 8.054, to target the pivotal support level 7.254.
 ‘Ready to trade FX Natural Gas? Here are the best commodity trading platforms to choose from.

