Ultimately, this is a market that has had a nice run higher, a 50% pullback from the last rally, and now looks as if it is trying to continue that overall move.
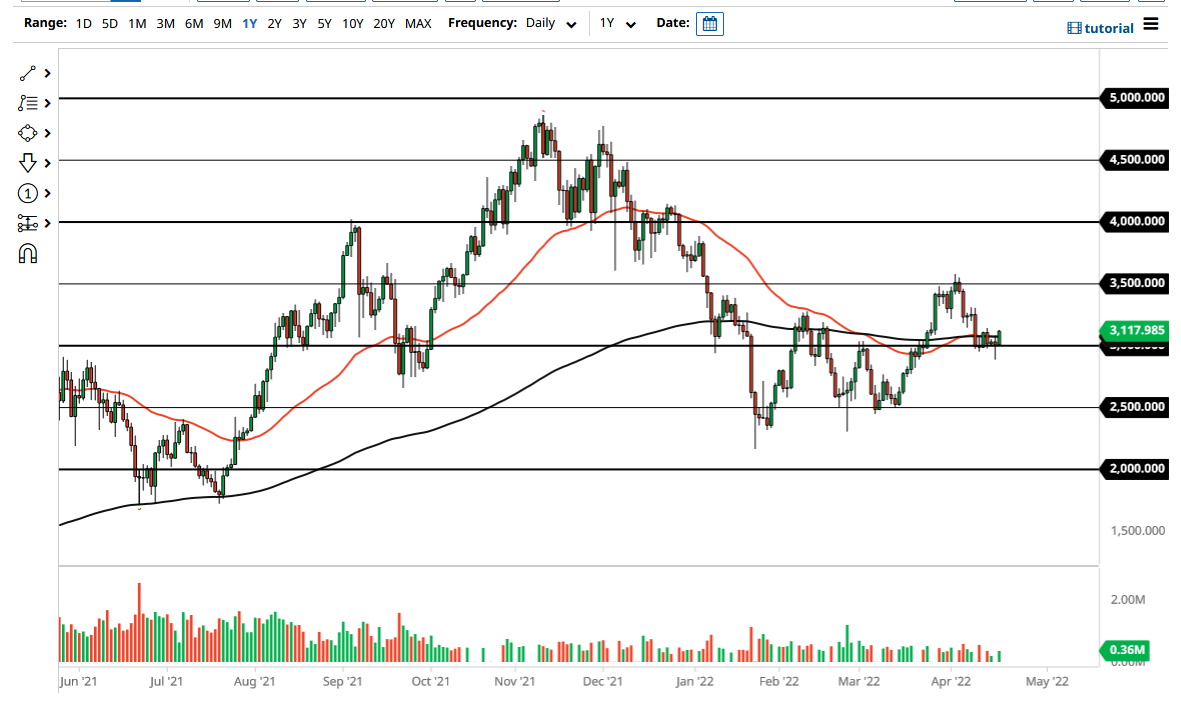
The Ethereum market rallied during the trading session on Tuesday to show signs of life, as the $3000 level has been significant support. The hammer during the trading session on Monday has been a nice marker for support, and the fact that we have turned around and recovered the $3000 level is a very good sign. The 50 Day EMA and the 200 Day EMA are both slicing through the candlestick and going flat. Ultimately, this is a market that I think will continue to see a lot of noisy behavior, but if we can hang on to this $3000 level, it would be a very bullish sign.
If we break above the highs of the trading session on Tuesday, then it is likely that the market could go to reach the $3250 level, which is where we had sold off previously. Breaking above there then will allow the market to go looking to reach the $3500 level. The $3500 level is an area that has been massive resistance previously, and for that matter had been supported before then. Ultimately, this is a market that has had a nice run higher, a 50% pullback from the last rally, and now looks as if it is trying to continue that overall move.
The market breaking down below the bottom of the hammer on the Monday session would be negative, opening up the possibility of a drop to the $2750 level, maybe even the $2500 level. The $2500 level has been massive support multiple times, and therefore it makes sense that we would see that area offer a significant support barrier if we drop down to that region. If we were to break down below the $2500 level, then it is very likely that Ethereum could drop down to the $2000 level. The $2000 level of course has a certain amount of psychology attached to it, but I think if we start to press that issue, it is very likely we will have entered “crypto winter.”
In general, this is a market that I think will continue to be very choppy and noisy but is trying to do everything it can to recover. As things stand right now, I do think we have a good chance, but one long negative candlestick could change things rather rapidly.


