Our expectations indicate a further decline for the index during its upcoming trading.
The Dow Jones Industrial Average declined during its recent trading at the intraday levels, to break a series of gains that continued for six consecutive sessions. It recorded losses in its last sessions by -0.67%, to lose the index towards -222.84 points to settle at the end of trading at the level of 32,990.13. This is after rising with trading on Monday, by 1.76%, the index closed the month of May with a slight monthly gain of 0.04%.
President Joe Biden met with Federal Reserve Chairman Jerome Powell Tuesday afternoon to discuss the economy and inflation. In an opinion piece in the Wall Street Journal, Biden said he would not seek to influence the Fed’s decisions.
On the economic data front, the Conference Board’s index of consumer confidence fell slightly in May to 106.4 from 108.6 in April, reflecting concerns about rising inflation and a slowing economy. Economists polled by the Wall Street Journal had expected the index to reach 103.9.
US home prices rose again in March even as mortgage rates rose, leaving prices at all-time highs. The Standard & Poor’s CoreLogic Case-Shiller Price Index for 20 cities is up 21.2% year over year, while the Federal Government Price Index is up 19% in the same period.
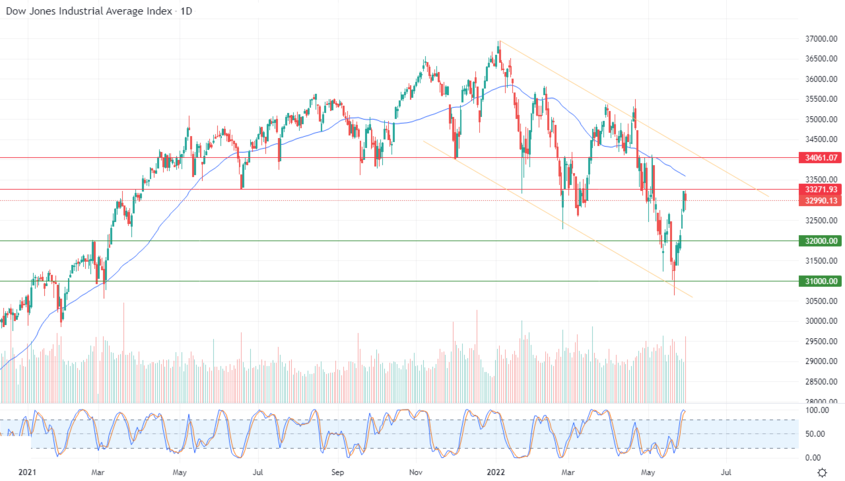
Technically, the index’s decline comes as a result of the stability of the resistance level 33,271.90, that resistance that we referred to in our previous reports. This is in light of the dominance of the corrective bearish trend in the short term. It’s trading within the range of a bearish price channel, as shown in the attached chart for a (daily) period. The continued negative pressure of its trading is below the simple moving average for the previous 50-day period, as we notice during the beginning of a negative crossover with the relative strength indicators. This is after it reached areas of severe overbought, in an exaggerated way compared to the movement of the index which suggests the start of a negative divergence in it.
Therefore, our expectations indicate a further decline for the index during its upcoming trading, as long as the resistance level 33,271.90 remains intact, to target the main support level 32,000.


