Get the Forex Forecast using fundamentals, sentiment, and technical positions analyses for major pairs for the week of July 4, 2022 here.
The difference between success and failure in Forex / CFD trading is very likely to depend mostly upon which assets you choose to trade each week and in which direction, and not on the exact methods you might use to determine trade entries and exits.
So, when starting the week, it is a good idea to look at the big picture of what is developing in the market as a whole, and how such developments and affected by macro fundamentals, technical factors, and market sentiment. Read on to get my weekly analysis below.
Fundamental Analysis & Market Sentiment
I wrote in my previous piece last week that the best trades for the week were likely to be:
- Long of USD/JPY following a daily (New York) close above €135.47. This set up on Monday and produced a losing trade of 0.15%.
- Short of BTC/USD following a daily (New York) close below $18,500. This did not set up.
- Short of ETH/USD following a daily (New York) close below $993. This did not set up.
The news is currently dominated by political items that do not have major economic impact. After more than four months, the war in Ukraine has faded away from its former place as a lead news item and appears to be having little effect on markets except possible weighing on global recession fears. Although there is much talk about a rise in the prices of agricultural commodities such as Wheat and Corn, recent days have seen strong falls in the prices of commodities.
Last week was dominated by continuing poor risk appetite. The US stock market is still in a bear market. The first half of 2022 was the worst for the US stock market since 1970. The US Dollar is strengthening.
The past week has seen overall directional movement notably lower, although valid trends remain effective in the Forex and cryptocurrency markets.. As we are now in July, it may be that we are about to get into a summer lull of dull markets with no breakouts. This often happens during the months of July and August, hence the adage “sell in May and go away.”
There were very few important economic data releases clast week, which is why market volatility was so low. The results came in as follows:
-
US Core PCE Price Index data – rose by 0.3% month on month, lower than the 0.4% which had been expected, giving some hope that inflation in the US may have already peaked.
-
Euro area annual inflation is expected to be 8.6% in June 2022, up from 8.1% in May according to a flash estimate from the EU.
-
US CB Consumer Confidence data – came in a bit lower than expected, suggesting consumer demand is shrinking.
-
US ISM Manufacturing PMI data – came in a bit lower than expected, which is typically bearish for the US Dollar.
The Forex market saw another advance by the the US Dollar last week. The Canadian Dollar, the Swiss Franc, and the Japanese Yen are also strong currencies. The other major currencies are all weak, especially the British Pound.
Rates of coronavirus infection globally again rose last week against the long-term downwards trend, suggesting that we are in a new major wave, possibly driven by the new omicron BA5 subvariant. The significant growths in new confirmed coronavirus cases overall right now are happening in Albania, Bangladesh, Brunei, Croatia, Iraq, Israel, Lebanon, Pakistan, Qatar, Switzerland, UK, Austria, Bahrain, Cyprus, France, Germany, Greece, Guatemala, Haiti, Italy, Mexico, Malta, Morocco, and the UAE.
The Week Ahead: 4th July – 8th July 2022
The coming week in the markets is likely to considerably more volatile than last week, as there are more high-impact data releases scheduled this week. They are, in order of likely importance:
-
US FOMC Meeting Minutes
-
US Non-Farm Payrolls data
-
Swiss CPI
-
Australia Cash Rate & Rate Statement
-
US JOLTS Job Openings
-
US Employment data
-
Canadian Employment data
It is a public holiday in the USA on Monday 4th July.
Technical Analysis
U.S. Dollar Index
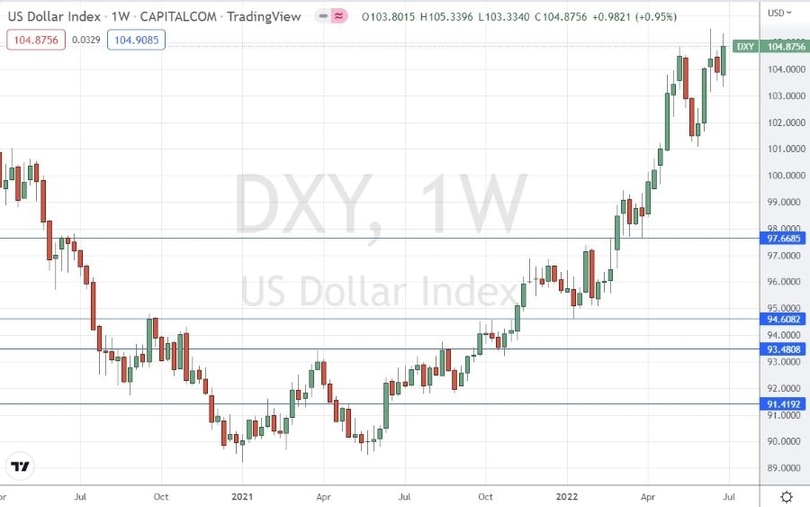
The weekly price chart below shows the U.S. Dollar Index printed a bullish outside bar after falling from to end the week at a new 20-year high, in line with the long-term trend, which is bullish. This is significant as breaks to new high closes suggest the price will rise further over the coming days.
It is worth noting that the US Dollar’s long-term bullish trend has been boosted, so far, by rising inflation and interest rates. However, as the US economy comes closer to a statistical recession, the more the US Dollar may become subject to bearish pressures.
It looks wise to trade the US Dollar long over the coming week unless it is hit hard by the release of FOMC Meeting Minutes, which is unlikely.

US Dollar Index Weekly Chart
BTC/USD
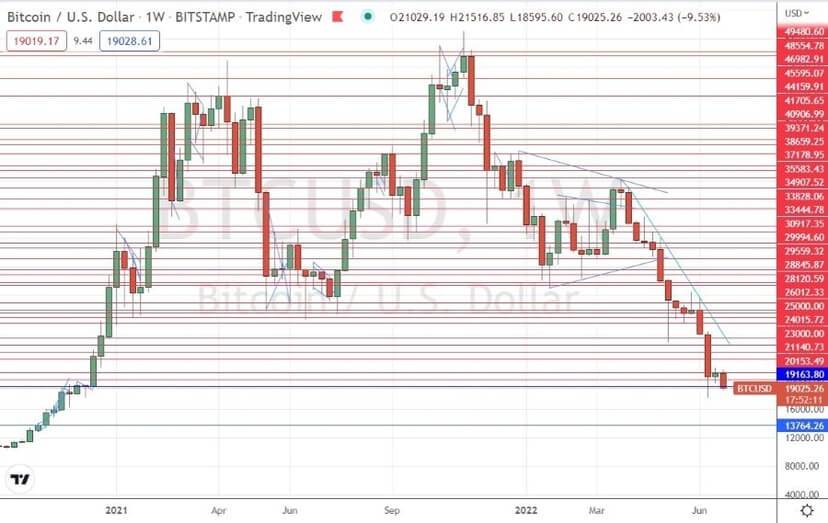
Bitcoin fell again last week, but not by a large amount, after spending the previous week making a small consolidation after it had been falling very sharply recently in line with its long-term bearish trend. The week ended with a bearish engulfing bar which is trading very near its low, suggesting a stronger bearish breakdown could be very close.
It looks as if Bitcoin is likely to fall further eventually. The price could easily reach the $13k area technically, meaning a short here could still be an interesting trade.
I am ready to enter a short trade if we get a daily (New York) close below $18,500 during this week.
The price chart below shows that $13,788 looks like the technical support level which might signify a full bursting of the Bitcoin bubble.

BTC/USD Daily Chart
ETH/USD
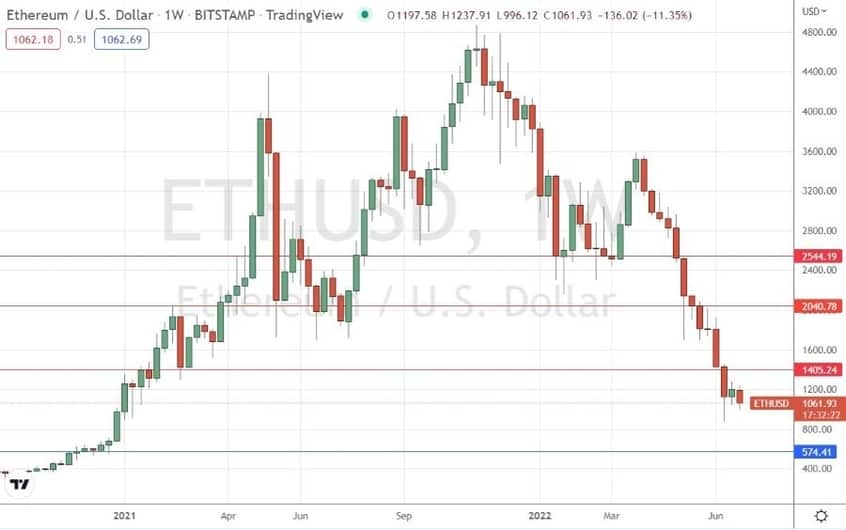
Just like Bitcoin, Ethereum also fell over the course at last week and remains near its low, in line with a long-term downwards trend which has seen it lose a great deal of value – as much as 30% two weeks ago.
It looks as if Ethereum is still likely to fall further eventually, and the moment of the major breakdown seems close. The price could easily reach the $571 area technically, meaning a short here could still be an interesting trade.
I am prepared to enter a short trade if we get a daily (New York) close below $993 during this week.
The price chart below shows that $571 looks like the technical support level which might signify a full bursting of the crypto bubble.

ETH/USD Weekly Chart
GBP/USD
Recent weeks and months have seen a lot of strength generally in the US Dollar, but the British Pound is also standing out lately as an especially weak currency due to expectations of inflation reaching greater than 11% soon as well as other economic woes, making the GBP/USD currency pair exciting to trade short.
The price has recently made new 2-year lows, which is technically significant, and closed last week at the lowest weekly closing price seen in 2 years after falling over the week.
There are good reasons to be bearish here, but technically we saw some strong buying last week when the price briefly traded below the round number at $1.2000. Therefore, I recommend waiting for a daily close below the support level at $1.1975 before considering entering a short trade here.

GBP/USD Weekly Chart
Bottom Line
I see the best opportunities in the financial markets this week as likely to be:
- Short of GBP/USD following a daily (New York) close below $1.1975.
- Short of BTC/USD following a daily (New York) close below $18,500.
- Short of ETH/USD following a daily (New York) close below $993.

