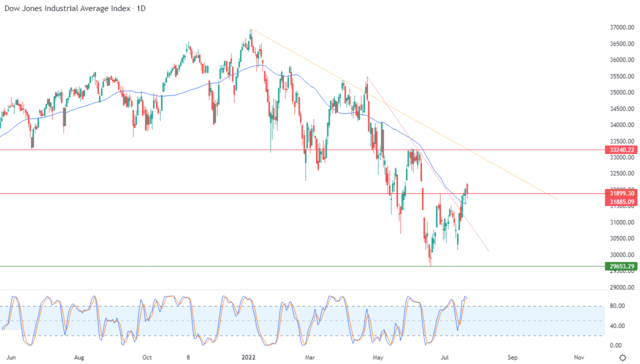
The Dow Jones Industrial Average declined during its recent trading at the intraday levels, to break a series of gains that continued for five consecutive sessions. It recorded losses in Friday’s trading by -0.43%, to lose about -137.61 points and settled at the end of trading at the level of 31,899.30. This is after rising in trading Thursday, by 0.51%. During the past week, the index rose by 1.95%, which is the best weekly performance of the index since June 24.
All eyes are on the Federal Reserve meeting and US Q2 GDP data next week, and while the US Central Bank is expected to raise interest rates by 75 basis points to curb hyperinflation, the GDP data is likely to be negative again.
Friday’s survey showed that business activity in the United States contracted for the first time in nearly two years in July, deepening concerns about an economy suffering from sagging growth due to rising inflation and rising interest rates as well as eroding consumer confidence.
Volume on US stock exchanges reached 10.38 billion shares, compared to an average of 11.53 billion for the full session over the last 20 trading days.
Where is the Index Headed Today?
Technically, the index, with its recent decline, is trying to make quick profits for its previous rises. It is trying to gain positive momentum that may help it recover and rise again. This is in addition to trying to drain some of its clear buying saturation with the relative strength indicators. This is especially with the beginning of the emergence of a negative crossover in it, amid its impact on the support provided. Because of its trading above its simple moving average for the previous 50 days, the corrective bearish trend is still the dominant trend in the short term and along a slope line, as shown in the attached chart for a (daily) period.
Therefore, our expectations suggest a return to the index’s rise during its upcoming trading, especially in the event of confirming its breach of the current resistance 31,885, to target the resistance level 33,240.

Ready to trade our Dow Jones trading signals? Here are the best CFD brokers to choose from.

