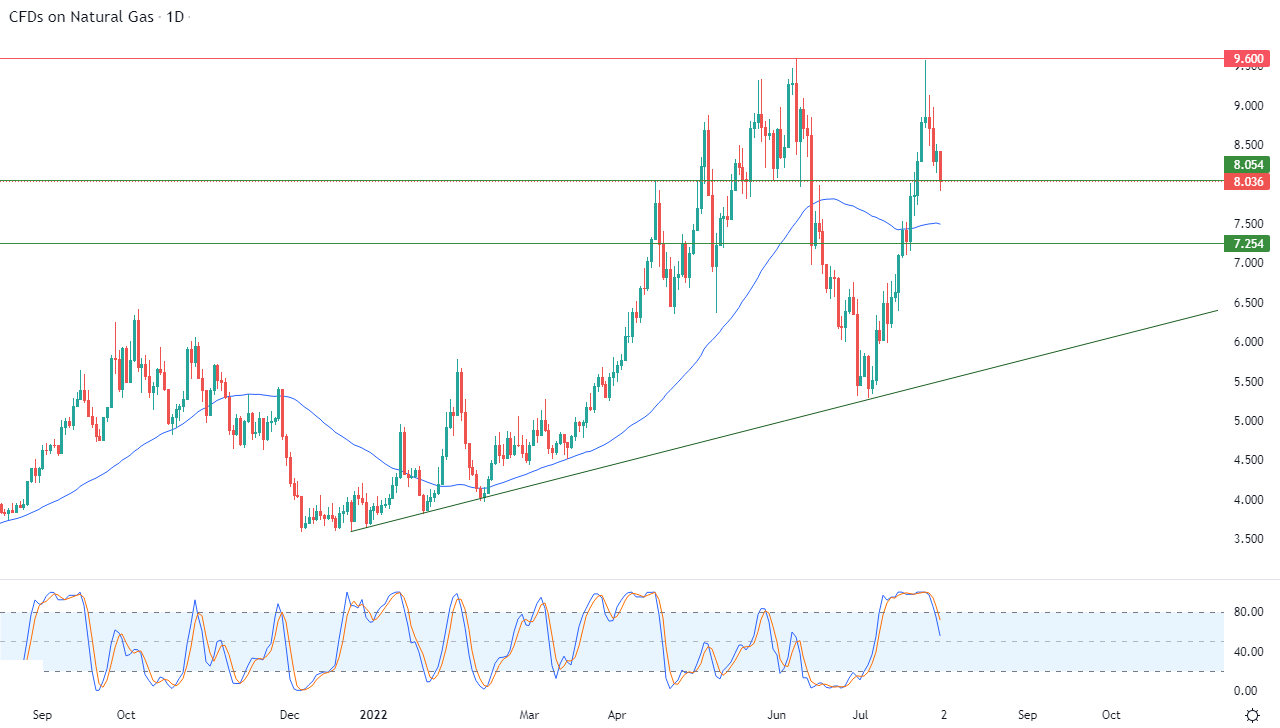
Spot natural gas prices (CFDS ON NATURAL GAS) resumed their decline in recent trading at intraday levels, to record daily losses until the moment of writing this report, by -4.60%. It then went to settle at the price of $8.028 per million British thermal units, after rising during trading on Friday. By 1.52%, during the past week the price rose by 1.50% after the price reduced its early gains at the beginning of the week, while during the month of July the price rose sharply by 54.26%.
Strong demand for cooling in the US led to a strong advance in spot prices on Monday and Tuesday, but prices fell in the last two days of the week ahead of expectations of a lack of summer heat over the weekend, but that was not enough to erase early gains during the week .
Russia and Gas Production
Earlier this week, Kommersant daily reported on Monday, citing informed sources, that Russia increased its daily oil and gas condensate production in July by 2% from the previous month to 1.468 million tons, or 10.76 million barrels per day.
Russian oil production fell sharply after Moscow faced Western sanctions when it sent troops into neighboring Ukraine in February, but production has gradually begun to increase over the past months but is still below pre-sanction levels.
Russia has again reduced gas flows to Europe through the Nord Stream 1 pipeline over the past week from 40% to only 20% of its capacity. Russia’s state-owned Gazprom has blamed delays in equipment deliveries linked to Western sanctions imposed to protest the Kremlin’s invasion of Ukraine, though analysts viewed the move as retaliation for the sanctions.
The Organization of the Petroleum Exporting Countries (OPEC) and its allies led by Russia, collectively known as OPEC+, will by August fully cancel record production cuts since the outbreak of the COVID-19 pandemic in 2020.
Natural Gas Technical Forecast
Technically, the recent decline in natural gas comes as a result of the stability of the pivotal resistance level 9.60, to reap the profits of its previous rises. It also tries to gain positive momentum by searching for a bullish bottom to take as a base that might help it recover its recovery and rise again. It is trying to drain some of its saturation of the clear buying of the relative strength indicators, especially with the influx of negative signals from them.
All of this comes in light of the dominance of the main bullish trend over the medium and short term along a slope line, as shown in the attached chart, with the continuation of positive support for its trading above its simple moving average for the previous 50 days.
Therefore, our expectations still suggest a return to the rise of natural gas during its upcoming trading, especially if the support level 8.054 remains intact, to target the pivotal resistance level 9.60 again.

Ready to trade Natural Gas Forex? Here’s a list of some of the best commodity trading brokers to check out.

