Solana has long been a favorite of institutional money, and now that it seems like plenty of that is willing to flow back into the crypto markets, Solana will almost certainly attract quite a bit of attention.
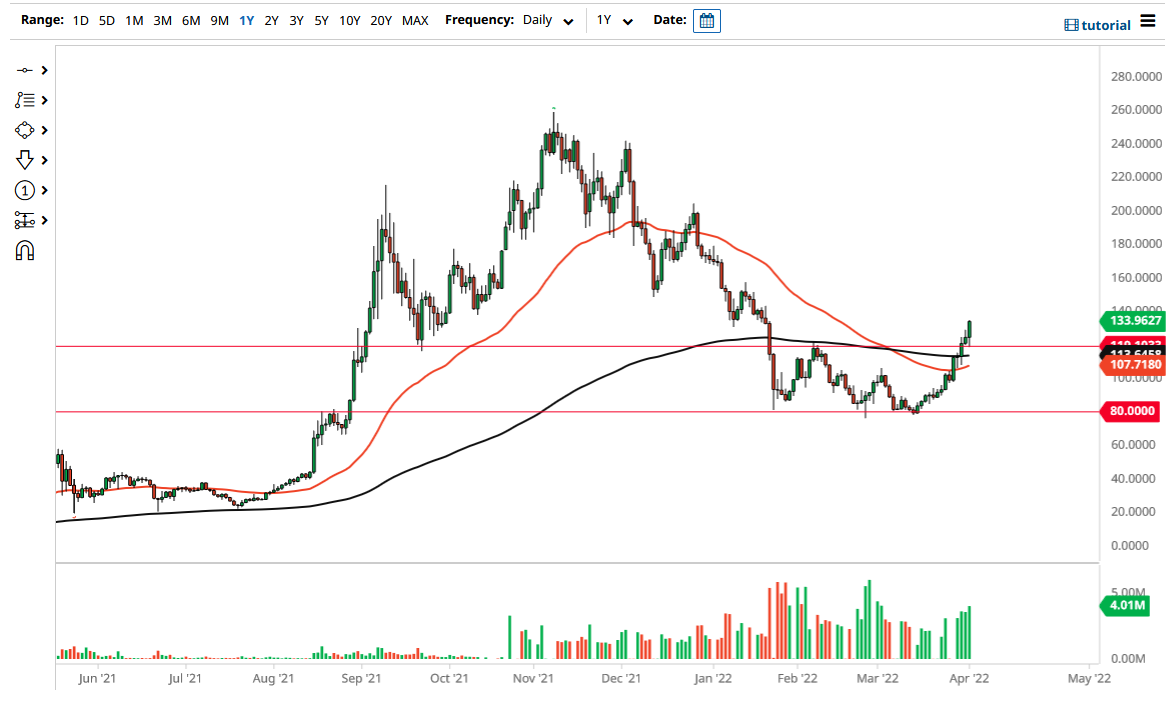
Solana pulled back ever so slightly on Friday but found the $120 level to be supportive enough to turn things around. The size of the candlestick is rather impressive, and it does suggest that we will have a bit of follow-through. This is especially true considering that we are closing at the very top of the candlestick, and now I think that there will be plenty of people willing to jump in to this market and buy on the dips when it happens.
The 50 Day EMA is starting to curl higher and is threatening to break above the 200 Day EMA over the next couple of days. This would form the so-called “golden cross”, which is something that a lot of longer-term traders pay attention to. Whether or not that attracts more buyers is a completely different question, but as things stand, longer-term traders do tend to pay close attention to it.
As long as we can stay above the 200 Day EMA, it is very likely that the market will continue to find plenty of buyers, and therefore I think it is likely that we will go looking to the $160 level, perhaps even the $200 level above. Short-term pullbacks should continue to attract a certain amount of attention, and you should always keep in mind that Solana tends to follow Ethereum and Bitcoin over the longer term. For what it is worth, Bitcoin has taken off, pulled back, and now looks ready to take off to the upside again.
Solana has long been a favorite of institutional money, and now that it seems like plenty of that is willing to flow back into the crypto markets, Solana will almost certainly attract quite a bit of attention. This being the case, the Solana market will then be a major beneficiary from that increased liquidity.
If we were to turn around and break down below the 50 Day EMA, it could send Solana down to the $80 level underneath where we had formed such a support level. In fact, you can see that there had once been a descending triangle, but never broke down and therefore it suggests that the overall trend has finally changed quite significantly over the last couple of weeks. This does not necessarily mean that the market will go straight up in the air, but it does suggest that longer-term traders will continue to look to the upside.


