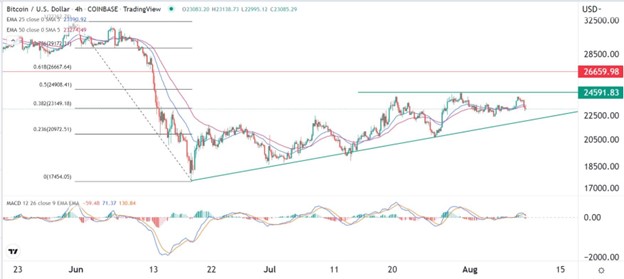
It will likely continue consolidating and then make a bullish breakout later this month.
Bullish View
- Set a buy-stop at 23,700 and a take-profit at 24,600.
- Add a stop-loss at 22,500.
- Timeline: 1-2 days.
Bearish View
- Set a sell-stop at 22,500 and a take-profit at 20,000.
- Add a stop-loss at 24,000.
The BTC/USD price declined during the overnight session as focus shifted to the upcoming US inflation data and as equities pulled back. The pair dropped to a low of 23,117, which was lower than this week’s high of 24,600.
Inflation Data Ahead
Bitcoin has been in an extremely tight range recently as investors focus on the upcoming US consumer and producer inflation data.
Economists polled by Reuters believe that consumer inflation pulled back slightly last month because of the falling oil prices. For example, after peaking at $5 per gallon, gasoline prices dropped to $4.03 at the end of the month. This is notable since gasoline is one of the top drivers of inflation in the US.
These numbers will come a few days after the US published extremely positive jobs numbers. Data published by the Bureau of Labor Statistics (BLS) showed that the economy added 528k jobs while the unemployment rate dropped to 3.5%.
Therefore, there is a likelihood that the Federal Reserve will continue tightening in the coming months. Analysts now believe that the bank will hike interest rates by 0.50% in September followed by two 0.25% hikes in the final two meetings of the year.
The BTC/USD pair also declined after Interactive Brokers expanded into the crypto industry. Users of the platform will be able to trade digital assets on a 24/7 basis. The expansion has been made possible by a relationship with Paxos, a leading digital asset company.
The news was important because Interactive Brokers is one of the biggest financial services companies globally. It has millions of users and a market cap of over $25 billion. Still, many companies in the sector like Coinbase and Robinhood have seen subdued market activity this year.
BTC/USD Forecast
The four-hour chart shows that the BTC/USD pair has been in a consolidation phase in the past few days. It has remained in a range of between 22,500 and 24,600. The pair was trading at 23,100 on Wednesday morning, which was along the 38.2% Fibonacci Retracement level. It was also along the 25-day and 50-day moving averages.
At the same time, the pair has formed an ascending triangle pattern, which is about to reach its confluence point. Therefore, it will likely continue consolidating and then make a bullish breakout later this month.

Ready to trade our free daily Forex trading signals? We’ve shortlisted the best MT4 crypto brokers in the industry for you.

