Previous BTC/USD Signal
My previous signal on 31st March was not triggered, as there was no sufficiently bullish price action when the price first reached the support level which I had identified at $45,668.
Today’s BTC/USD Signals
Risk 0.50% per trade.
Trades may only be entered before 5pm Tokyo time Tuesday.
Long Trade Ideas
- Long entry after a bullish price action reversal on the H1 timeframe following the next touch of $45,595 or $44,160.
- Put the stop loss $100 below the local swing low.
- Move the stop loss to break even once the trade is $100 in profit by price.
- Remove 50% of the position as profit when the trade is $100 in profit by price and leave the remainder of the position to ride.
Short Trade Ideas
- Short entry after a bearish price action reversal on the H1 timeframe following the next touch of $46,983 or $48,555.
- Put the stop loss $100 above the local swing high.
- Move the stop loss to break even once the trade is $100 in profit by price.
- Remove 50% of the position as profit when the trade is $100 in profit by price and leave the remainder of the position to ride.
The best method to identify a classic “price action reversal” is for an hourly candle to close, such as a pin bar, a doji, an outside or even just an engulfing candle with a higher close. You can exploit these levels or zones by watching the price action that occurs at the given levels.
BTC/USD Analysis
I wrote last Thursday that the price action looked distributive, so overall the technical evidence suggested that the price was due a slow fall to at least the nearest support level at $45,668.
I was hoping for a short trade from a bearish reversal at $48,555.
This was a good call as I was correct about the directional move, the price fell to reach and exceed $45,668 over that day.
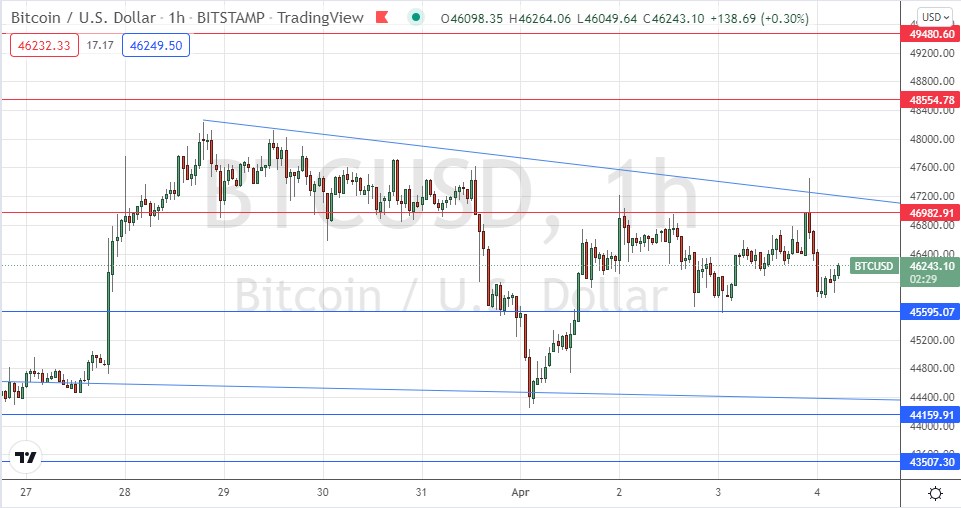
The technical picture now looks a little more bearish than it did a few days ago. The distributive consolidative price action below the strong resistance at $48,555 has continued, and we see a new resistance level having developed at $46,982 which is reinforced by a confluent descending trend line shown in the price chart below.
Despite the selling pressure bearing down from above, we see some bullish action below, with higher lows basing off the key support level at $45,595.
I think the price is likely to consolidate between $45,595 and $46,982 today. If the price gets established later below $45,595 that will be a bearish sign. Although a break above $46,982 will be a bullish sign, the real test for bulls will only come when they can test the higher resistance level at $48,555.
Day traders trading Bitcoin today will probably do well to look for long trades above $46,982 (being cautious to take profit near $48,555) or short trades if the price gets below $45,595.

There is nothing of high importance scheduled today concerning the USD.

