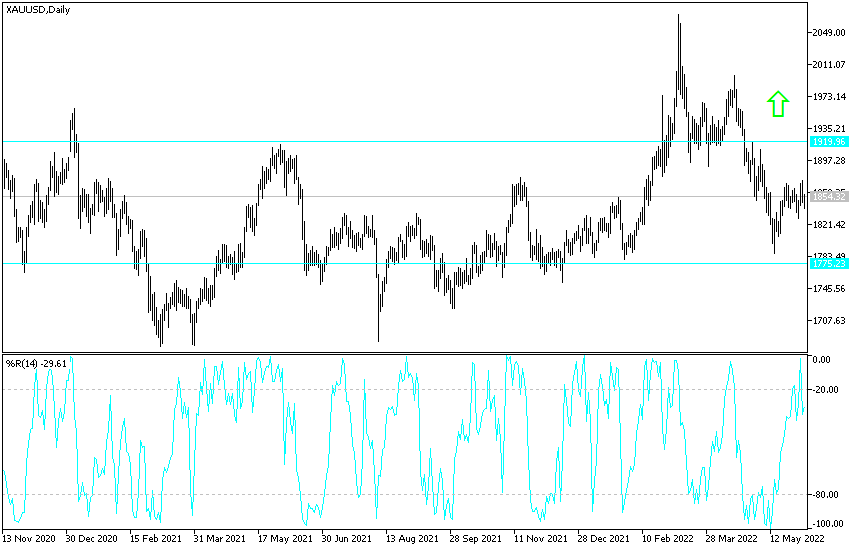
Gold futures are struggling to hold on to weekly gains after a strong US jobs report for May raised the likelihood of maintaining the Federal Reserve’s approach to fighting inflation. Although the yellow metal is still high this year, it has been on a steady decline since March. After the US data was announced, the price of gold fell to the support level of $1840 an ounce at the beginning of this week’s trading, before settling around the $1856 level at the time of writing the analysis. Before the US jobs data, the price of gold maintained gains that reached the resistance level of 1875 dollars for an ounce. The gold price left its gains since the start of the year 2022 to date at 1.11%.
In the same way, the price of silver, the sister commodity to gold, fell below $ 22 again. Accordingly, the price of the white metal erased about 1.2% of the week’s gains, adding to its decline since the start of the year 2022 to date by more than 6.3%.
On the economic side, in May, the US economy added a total of 390,000 jobs, beating market estimates of 325,000. This was the lowest employment gain in 13 months. The country’s unemployment rate stabilized at 3.6%, while the labor force participation rate rose to 62.3%. Average hourly wages rose 0.3%, average weekly hours were unchanged at 34.6, and the national employment rate is still 0.5% lower than the pre-pandemic level.
Overall, the strong US jobs report prompted investors to acknowledge that the Fed is likely to continue tightening by raising US interest rates by 50 basis points and cutting its $9 trillion balance sheet.
The gold market in general is sensitive to a high interest rate environment as it increases the opportunity cost of holding non-return bullion. Moreover, the US Treasury market was up across the board, with the benchmark 10-year bond yield rising 4.6 basis points to 2.961%. Yields on one-year notes rose 3.6 basis points, while yields on 30-year notes jumped 4.6 basis points. The US Dollar Index (DXY) rose to 102.18, from the opening at 101.82. The index measures the performance of the US currency against a basket of major currencies, and it achieved a weekly gain of 0.5%, which raises its rise since the start of the year 2022 to date to 6.5%.
In general, a stronger profit is bad for dollar-priced commodities because it makes them more expensive to buy for foreign investors.
Among other economic data, the US Institute of Supply Management’s (ISM) non-manufacturing purchasing managers’ index fell to 55.9 in May, below market expectations of 56.4. Business activity fell, employment rose, new orders rose, and prices fell.
In other metals markets, copper futures fell to $4.464 a pound. Platinum futures fell to $1013.20 an ounce. And futures contracts for palladium fell to 1975 dollars an ounce.
According to the technical analysis of gold: Despite the recent performance, the price of gold has the opportunity to rebound higher as long as it is stable around and above the resistance 1850 dollars an ounce on the daily chart below. The bulls will need to move towards the resistance levels 1877, 1885 and 1900 dollars, respectively, to confirm the control in gold trend. I still prefer buying gold from every bearish level and the closest and most appropriate buying levels are 1838 and 1820 dollars an ounce respectively. I expect a quiet trading session today.


