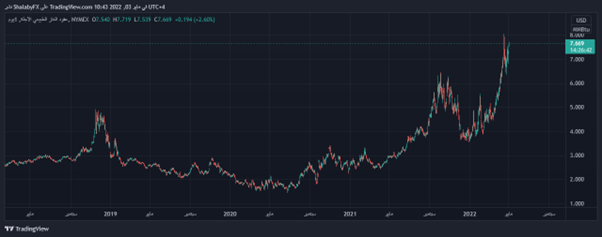
It achieved slight daily gains until the moment of writing this report, by 2.53% to settle at the price of $7.664 per million. This is after declining sharply in last week’s trading, by -6.07%.
Natural gas prices fell last Thursday after three consecutive days of gains, with June futures in Nymex dropping 45.1 cents to $6.888 per million British thermal units, and July futures dropping 44.2 cents to 6.994 dollar.
NGI’s Spot Gas National Avg, which traded Thursday for gas delivery on Friday and Saturday despite the continuation of unstable weather in the eastern US, was down 50.0 cents to $6,570.
The US Energy Information Administration (EIA) said that US natural gas inventories rose by about 40 billion cubic feet in the week ending April 22, and economists polled by the Wall Street Journal had expected a rise of 38 billion cubic feet.
Production in the US has shown some signs of recovery, but during the ongoing maintenance season production may fluctuate over the next couple of months, Canadian imports were lower with Mexican exports rising slightly.
On the technical analysis side, we are expected to see a decline in the price to reap the profits of its recent rises and try to gain some positive momentum that may help it recover and rise again. This is in light of the dominance of the main bullish trend in the medium term along a slope line, as shown in the attached chart for a period (daily). This is in addition to the continuation of the positive support for its trading above its simple moving average for the previous 50 days.


