[ad_1]
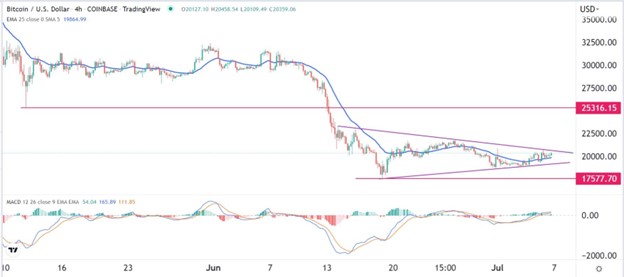
The pair will likely have a breakout in the coming days.
Bearish View
- Set a sell-stop at 19,600 and a take-profit at 18,000.
- Add a stop-loss at 21,500.
- Timeline: 1 day.
Bullish View
- Set a buy-stop at 20,800 and a take-profit at 22,000.
- Add a stop-loss at 18,000.
The BTC/USD price held steady at the 20,000 range as concerns about the crypto industry continued. Bitcoin is trading at $20,500, which is slightly above last week’s low of $18,622.
Has the Sell-Off Capitulated?
Bitcoin has been in a remarkable downward trend in the past few months as investors continue worrying about the industry. It is not alone considering that other cryptocurrencies like Ethereum, Ripple, and Cardano have all dropped. In total, the market cap of all cryptocurrencies has crashed from an all-time high of $3 trillion to below $1 trillion.
The BTC/USD pair tilted higher during the American session even after the relatively hawkish minutes by the Federal Reserve. The bank’s officials said that a more restrictive policy will continue in the coming months in a bid to fight inflation. That statement set the stage for another above normal rate hike of either 0.50% or 0.75%. The statement said:
“Many participants judged that a significant risk now facing the committee was that elevated inflation could become entrenched if the public began to question the resolve of the committee to adjust the stance of policy as warranted.”
Bitcoin rose in line with the performance of American equities as the Dow Jones, Nasdaq 100, and S&P 500 rose by more than 0.50%. Still, it is worth noting that stocks and Bitcoin and stocks tend to rise after Fed decisions and minutes and then erase these gains the following day.
Bitcoin is also reacting to corporate activity about cryptocurrencies. On Tuesday, Voyager Digital, a large Canadian exchange went bankrupt. In a positive sign, Nexo decided to acquire Vauld, a company that was on the verge of going bankrupt. FTX has also acquired BlockFi while Celsius is fighting for survival.
BTC/USD Forecast
The four-hour chart shows that the BTC/USD pair has been in a consolidation phase in the past few days. As a result, it has formed what looks like a symmetrical triangle pattern that is shown in purple. Now, this triangle is nearing its confluence level, meaning that a bullish breakout is likely. The pair is slightly above the 25-day moving average while the MACD has moved slightly above the neutral point.
Therefore, the pair will likely have a breakout in the coming days. While it is hard to predict, this breakout will likely be bearish since the triangle is likely a bearish pennant. If this happens, the next key support will be at 17,577.

[ad_2]
