[ad_1]
The pair will likely keep falling as sellers target the key support at 20,000.
Bearish View
- Sell the BTC/USD pair and set a take-profit at 20,000.
- Add a stop-loss at 23,000.
- Timeline: 1-2 days.
Bullish View
- Set a buy-stop at 22,470 and a take-profit at 23,500.
- Add a stop-loss at 21,000.
The BTC/USD pair retreated to the lowest level in more than a week as last week’s rebound faded. Bitcoin declined to a low of $21,805, which was about 10% below the highest level this month, giving it a market cap of over $420 billion.
Bitcoin Loses Momentum
The BTC/USD price declined sharply as cryptocurrency prices recoiled. The prices of most coins, including Ethereum, Tron, and Near Protocol declined, bringing the total market cap of all cryptocurrencies to about $1.06 trillion.
There will be two main catalysts for Bitcoin prices this week. The most important will be the upcoming interest rate decision by the Federal Reserve. With the American inflation soaring and with the unemployment rate falling to 3.7%, the bank will hike interest rates. Analysts expect that the bank will hike rates by as much as 1%.
The Fed will also hint that it will continue tightening throughout the year. However, analysts believe that the Fed will start a rate cut cycle in 2023 in a bid to boost an economy that will be hit by higher borrowing costs.
Expectations of rate cuts in 2023 explain why the US dollar has eased in the past few days. Indeed, the dollar index has moved from this month’s high of $109.30 to the current $106.
The BTC/USD price will react to the latest earnings from the biggest American companies like Apple, Microsoft, and Alphabet. While these companies don’t have any stakes in Bitcoin, they will affect its price by influencing the broader market.
Historically, Bitcoin has a close correlation with American stocks. Indeed, the current weakness can be attributed to the fact that US equities have dropped in the past two straight days. Analysts expect that most of these companies will publish weak results and point to soaring costs of doing business.
BTC/USD Forecast
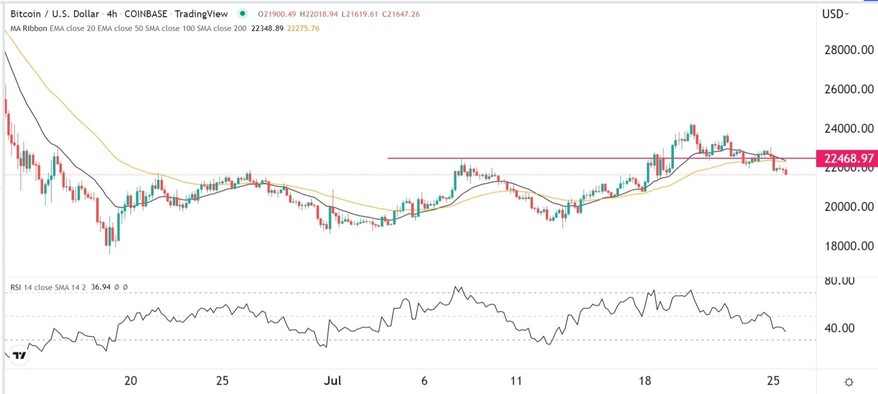
The four-hour chart shows that the BTC/USD pair has been in a strong bearish trend in the past few days. It managed to move below the important support level at $22,468 on Monday. This was a notable level since it was the highest point on July 8th.
The 25-day and 50-day moving averages have made a bearish crossover pattern. The Relative Strength Index (RSI) is approaching the oversold level of 30. Therefore, the pair will likely keep falling as sellers target the key support at 20,000.

Ready to trade our free trading signals? We’ve made a list of the best Forex crypto brokers worth trading with.
[ad_2]
