[ad_1]
Get the Forex Forecast using fundamentals, sentiment, and technical positions analyses for major pairs for the week of April 18, 2022 here.
The difference between success and failure in Forex trading is very likely to depend mostly upon which currency pairs you choose to trade each week and in which direction, and not on the exact trading methods you might use to determine trade entries and exits.
When starting the trading week, it is a good idea to look at the big picture of what is developing in the market as a whole and how such developments and affected by macro fundamentals and market sentiment.
There are a few strong trends in the markets, so it is an interesting time to be trading.
Fundamental Analysis & Market Sentiment
I wrote in my previous piece last week that the best trade for the week was likely to be long of USD/JPY, the 10-Year US Treasury Yield, Sugar, and Corn. This was a good call as USD/JPY rose by 1.67%, the 10-Year US Treasury Yield rose by 3.67%, Corn closed up by 1.95%, and Sugar declined by 0.10%, giving an averaged win of 1.80%.
The news remains dominated by the Russian invasion of Ukraine which is now into its second month. Russian forces have withdrawn from the northern part of the company, switching focus to the south and east of Ukraine. However, the war no longer seems to be having much impact on markets, beyond adding inflationary supply-side issues to a global economy already suffering from high and rising inflation, helping to keep the prices of many agricultural commodities such as corn buoyant. The war will have some negative effect upon the Eurozone economy.
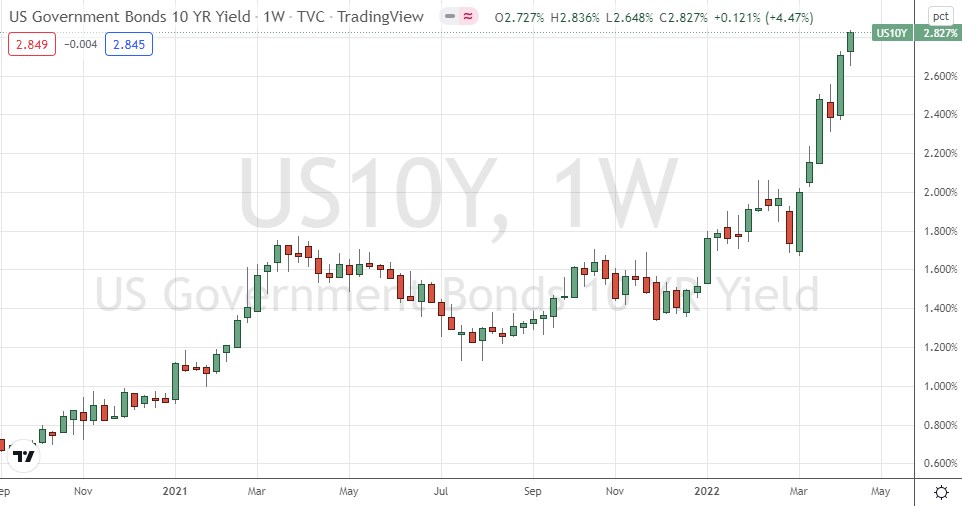
Markets are paying a lot of attention to inflation data and pace at which central banks are tightening monetary policy to fight the rising inflation without bringing down stock market overly quickly. This past week saw the inflation rate in the USA come in at another new 40-year high of 8.50%, but for the first time in a while, the data did not exceed expectations, and core CPI came in lower than expected. Despite this, the 10-Year US Treasury yield ended the week right on its multi-year high of 2.827%. In the UK, inflation data again exceeded expectations, coming in at a 30-year high of 7.00%, but the news had little effect upon the British Pound.
Stocks are doing very little, but the US Dollar is strong, and its yield is rising to new highs. There is action in the bond and Forex markets, where the Bank of Japan’s continuing talk of the USD/JPY currency pair at ¥130 causes the Yen to lose value every day. Commodities markets are very lively, with the inflationary environment pushing many agricultural commodities to break out to new long-term highs, notably corn.
In other news last week:
-
The Reserve Bank of New Zealand hiked rates by a full 0.50%, when a hike of only 0.25% had been widely expected.
-
The Bank of Canada also hiked rates, by 0.50%, which had been expected by the market.
Last week saw the global number of confirmed new coronavirus cases decline for the fourth consecutive week. Approximately 65% of the global population has now received at least one vaccination, and 6.4% are known to have contracted the virus.
The strongest growths in new confirmed coronavirus cases overall right now are happening in Barbados, Bhutan, Canada, China, Japan, and Taiwan.
The Week Ahead: 18th – 22nd April 2022
The coming week in the markets is likely to be less volatile as there are few data releases of high importance scheduled. They are, in order of likely importance:
-
China GDP
-
German Flash Manufacturing & Services PMI
-
Canada CPI (inflation)
-
New Zealand CPI (inflation)
Technical Analysis
U.S. Dollar Index
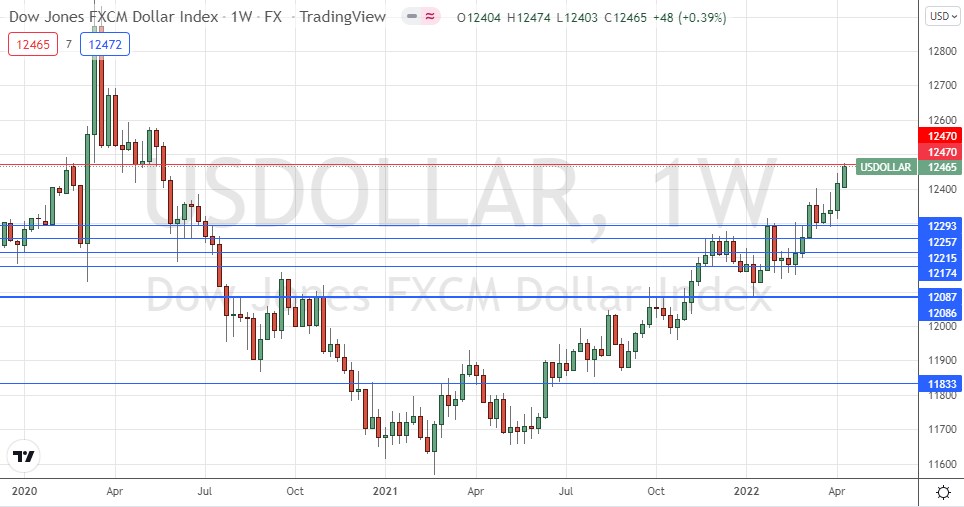
The weekly price chart below shows the U.S. Dollar Index again rose strongly last week, in line with the long-term bullish trend, printing a bullish candlestick that closed in the top quarter of its range. This was the highest weekly close seen since May 2020. The high of the weekly candlestick has initially rejected the key resistance level at 12470. Dollar bulls will be encouraged that the bullish momentum has continued, and the price has continued to advance to new highs. However, the key resistance level at 12470 may impede further progress, at least over the short term.
Despite the potential resistance, it will probably be wise to take trades in favor of the US Dollar in the Forex market over the coming week.
S&P 500 Index
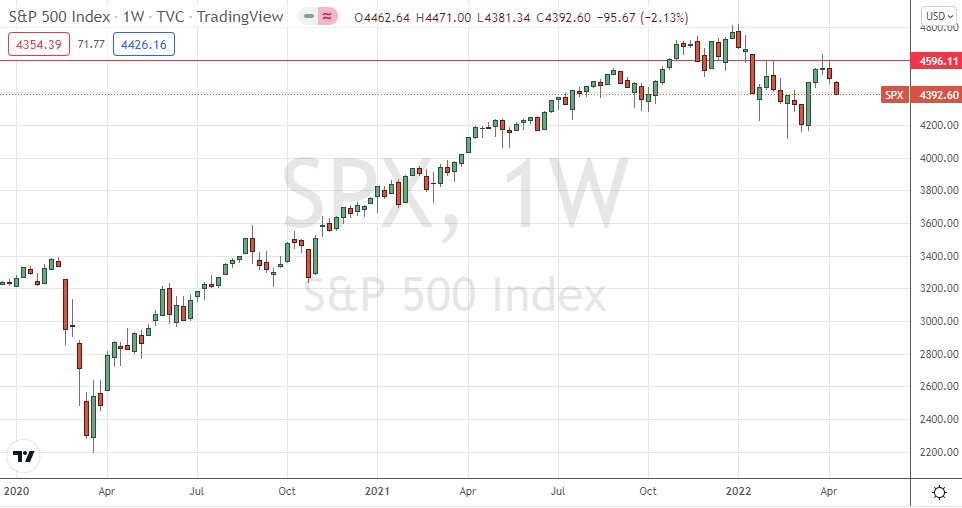
The world’s most important stock market index, the S&P 500, fell again last week, after rejecting the resistance level at 4596 which I have been noting over recent weeks. One the daily chart, the price is again trading below its 200-day simple moving average. These are bearish signs. However, downwards momentum is not yet strong enough to make any short trade here an interesting prospect.
I see the US stock market as an uncertain trade right now due to signs of deteriorating consumer demand and a tightening monetary policy from the Federal Reserve.
USD/JPY
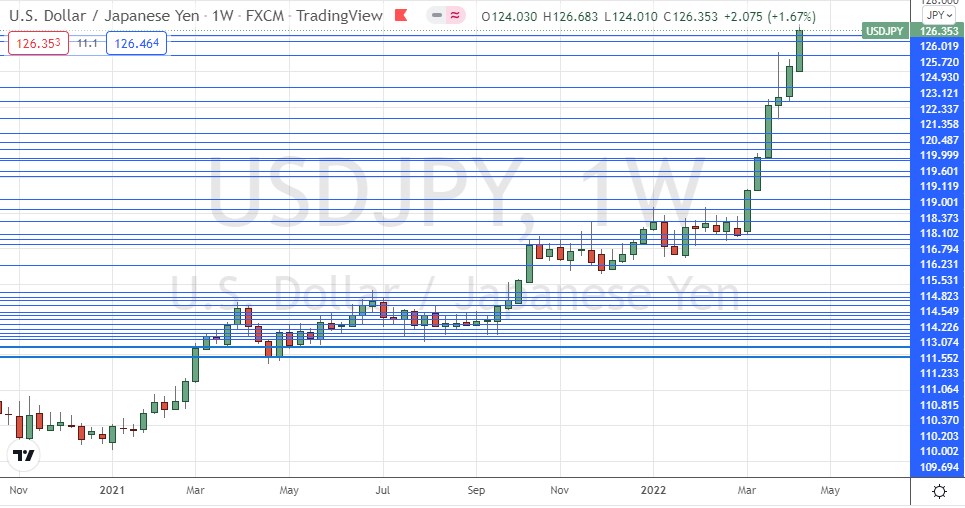
The USD/JPY rose very strongly over the past few weeks, pausing a week without making a new high, but the past week saw the strong bullish momentum come roaring back. The past week saw the price rise again strongly, peaking at ¥126.68, which is the highest price for almost 20 years.
There is a reason to keep looking to the bullish side after such a strong price movement and resumed bullish momentum, and public declarations from the Bank of Japan suggesting they could tolerate the price rising as high as ¥130 before intervening.
As long as the price remains above a key former resistance level at ¥124.93 last week, I am prepared to hold a long bias on this currency pair.
10-YR US Treasury Yield
There has been much focus on US treasury yields lately, after the yield curve briefly inverted a couple of weeks ago, and as the Fed and other major central banks begin to take significant steps to tighten monetary policy.
The US Dollar is the strongest major currency right now, and this is partly because the yields on its treasury bills continue to climb to new long-term highs not seen in 3 years.
The 10-year yield is increasing more strongly than the 2-year yield so the bullish momentum in treasury yields is here. This makes an attractive long trade if you have access to the right instrument to do it, such as a micro future or an ETF.
Corn
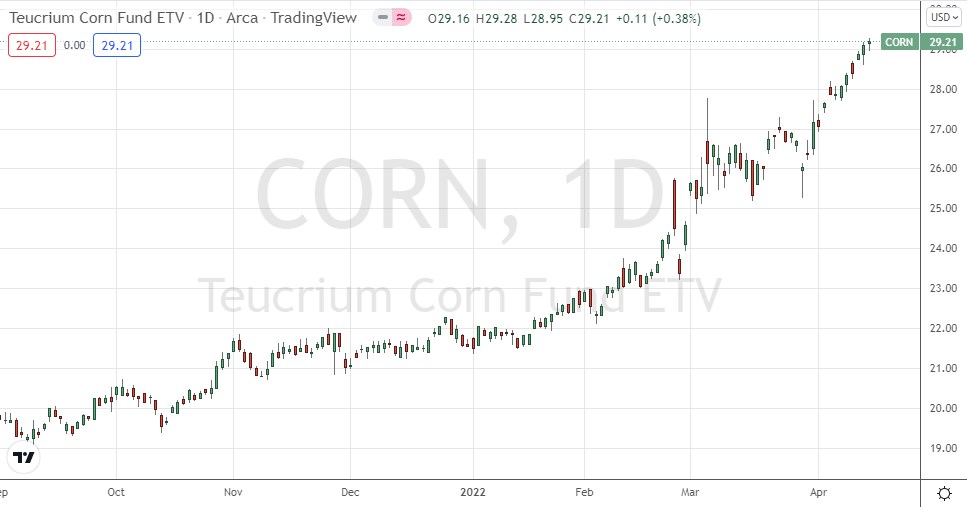
The price of corn has risen dramatically since 2022 began after consolidating over the second half of 2021. We have seen the price make a very strong push upwards that just keeps continuing, and the price of this basic foodstuff just keeps getting more and more expensive, driven partly by the ongoing war in Ukraine. We are in an era of high and rising commodity prices, partly spurred by historically high inflation levels as well as creaking supply chains.
The initial rise at the start of 2022 shown in the price chart below is a classic “cup and handle” Forex chart pattern, which can often indicate a coming strong price rise, as it seems to have done here.
There are great reasons to trade corn long, but it is not clear the price right now is at an optimal entry point. Some traders will prefer to wait for a bearish retracement followed by a resumption of the bullish trend before entering.
Bottom Line
I see the best opportunities in the financial markets this week as likely to be long of USD/JPY, the 10-Year US Treasury Yield, and Corn.
[ad_2]
