We still expect the index to return in its upcoming trading.
The Dow Jones Industrial Average declined during its recent trading at the intraday levels, to record losses for the second day, by -0.26%, to lose the index by -87.74 points. It settled at the end of trading at the level of 34,220.35, after its decline in Monday’s trading by -1.19%.
20 of the 30 index components fell, and Cisco Systems Inc. The biggest loss in the session was -2.00%, followed by Visa Inc. Cl A by -1.56%, followed by Merck & Co. Inc. By -1.15%.
The March CPI rose 8.5% y/y, above estimates of 8.4% and up from 7.9% in February. The core CPI result, which excludes food and energy prices, rose 6.5%, slightly above the last reading of 6.4%. Economists note that the decline in used car prices has affected inflation outcomes.
The latest inflation figure did not lift bond yields higher, as the 10-year Treasury yield fell to 2.725%, down 0.055 percentage points. This is a relief to the stock market after a rally that brought the yield up from 2.2% just a month ago. Expectations that the Federal Reserve will soon reduce its holdings of bonds, sending less money into the bond market, helped spur the sell-off in Treasuries.
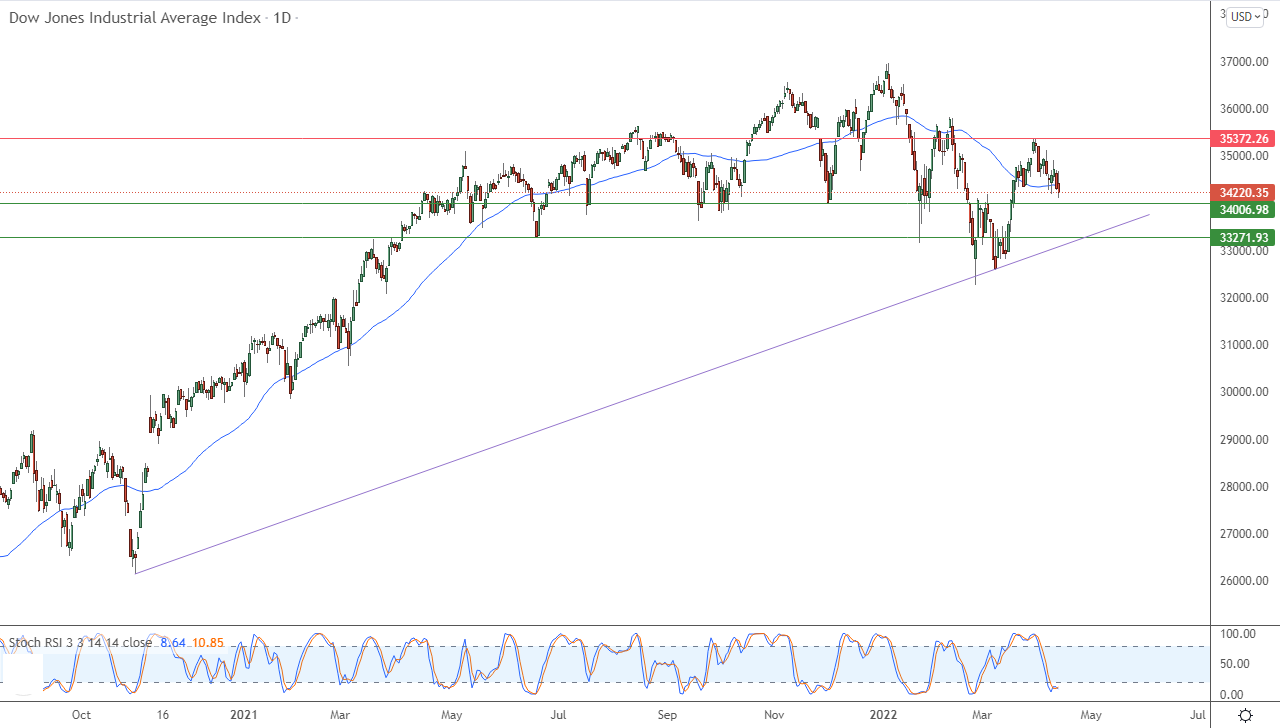
Technically, the index is trying in its recent trading to search for a bullish bottom to take as a base that might help it gain the necessary positive momentum to regain its recovery and rise again. This is in light of the dominance of the main bullish trend in the medium term along a slope line, as shown in the attached chart for a (daily) period. It will remain with its last closing based on the support of its simple moving average for the previous 50 days. In addition, we notice the beginning of a positive crossover in the RSIs, after reaching very oversold areas, and exaggeratedly compared to the index’s movement, which adds positive momentum to the index’s trading coming.
Therefore, we still expect the index to return in its upcoming trading, as long as the main support 34,000 remains intact, to target the resistance level 35,372.26.


