Binance coin will likely keep rising s bulls target the key resistance at $420.
Bullish View
- Buy the BNB/USD and set a take-profit at 420.
- Add a stop-loss at 390.
- Timeline: 1-2 days.
Bearish View
- Set a sell-stop at 395 and add a take-profit at 380.
- Add a stop-loss at 410.
The BNB/USD coin held steady after the Federal Reserve interest rate decision. The Binance Coin rose to a high of $405, which was the highest level since April 29th. It has risen by more than 6.25% from its lowest level this month, bringing its market cap to more than $67 billion.
Fed Rate Hikes
The Federal Reserve has a major impact on all financial assets, including cryptocurrencies and stocks. In a period of easy money, investors tend to invest in relatively risky assets like cryptocurrencies and growth stocks. On the other hand, they tend to invest in other safe assets when rates start rising.
The BNB price has been in a strong bearish trend in the past few months as the Fed and other central banks turned increasingly hawkish. The Fed made its first interest rate hike in March this year and hinted that it would implement more hikes this year.
On Wednesday, the bank decided to hike interest rates by about 0.50%, which was in line with expectations. Therefore, BNB is rising since the decision was in line with what analysts were expecting. At the same time, with the American economy slowing, there is a likelihood that future rate hikes will not be as severe as expected.
The BNB/USD rally is in line with what other assets have done. For example, the Dow Jones and Nasdaq 100 indices rose by more than 2% after the decision. The same trend has happened in Europe, where the DAX and Stoxx 50 rose by more than 2%.
The BNB price is also rising after Binance received its operating license in France as it seeks to grow its business in Europe. Further, the network’s total value locked (TVL) has risen by more than 2.8% to over $12 billion.
BNB/USD Forecast
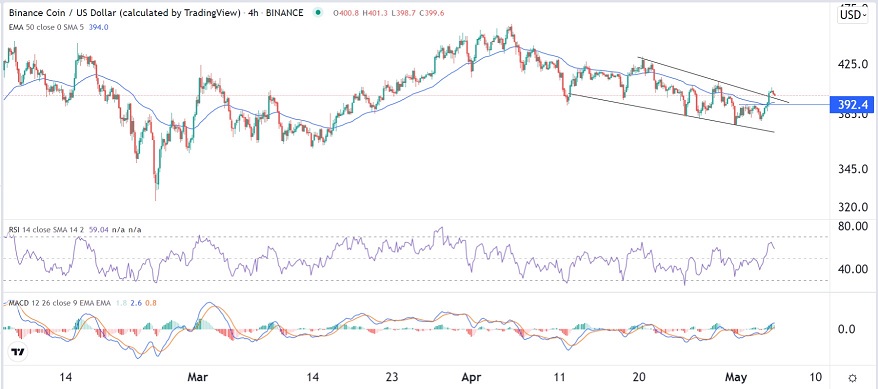
On the four-hour chart, we see that the Binance Coin price has made a strong bullish trend. It has moved slightly above the upper side of the descending channel pattern that is shown in black. The coin has moved slightly above the 25-day moving average while the Relative Strength Index (RSI) is approaching the overbought level. The MACD has moved slightly above the neutral level.
The coin also moved slightly above the resistance level at $392, which was the highest level in May. Therefore, the coin will likely keep rising s bulls target the key resistance at $420.


