The difference between success and failure in Forex / CFD trading is very likely to depend mostly upon which assets you choose to trade each week and in which direction, and not on the exact methods you might use to determine trade entries and exits.
So, when starting the week, it is a good idea to look at the big picture of what is developing in the market as a whole, and how such developments and affected by macro fundamentals, technical factors, and market sentiment. Read on to get my weekly analysis below.
There are still a few strong trends in the markets, and following them can help put the odds in your favor.
Fundamental Analysis & Market Sentiment
I wrote in my previous piece last week that the best trades for the week were likely to be:
- Short of EUR/USD following a daily (New York) close below $1.0378. There was no daily close below $1.0378.
- Short of BTC/USD following a daily (New York) close below $28,800. The price closed Monday at $28,681 but ended the week 2.33% higher from there.
The news remains dominated by the Russian invasion of Ukraine, which is well into its third month, but seems to have become stalemated by an effective, NATO-armed Ukrainian defense, funded by the US alone with more than $40 billion to date. Russian forces have withdrawn from the northern part of the company, switching focus to an offensive aimed at fully capturing the eastern and southern coastal regions of Ukraine. The war initially caused quite strong movements in some markets, especially in certain agricultural commodities such as Wheat and Corn, but now seems to be having little effect beyond weighing on global stock markets and keeping the price of Wheat relatively high. Of course, there are other fundamental factors weighing on stock markets, such as the specter of stagflation, and rising interest rates.
There is a risk-off sentiment gripping markets, but it is expressed mostly in falling stock markets and bearish action in cryptocurrencies, with the market currently treating these as the major “risk” assets. This is being driven by several fundamental and sentimental factors:
- The S&P 500 Index traded more than 20% off its high this week for the first time in two years, signaling the start of an official bear market in US stocks by any measurement.
- Inflation continues to a major concern, with Canadian CPI (inflation) data coming in last week slightly higher than expected, while UK CPI data came in slightly lower than expected, leading the week to end on a slightly more optimistic note after US CPI data released last week came in higher than expected two weeks ago.
- New data shows that private capital in the USA, which had been growing exponentially in value over recent years, is now shrinking quickly.
- Many analysts see the current long-term strength in the US Dollar as a drag on the global economy, as it prompts capital outflows from emerging and some developed markets.
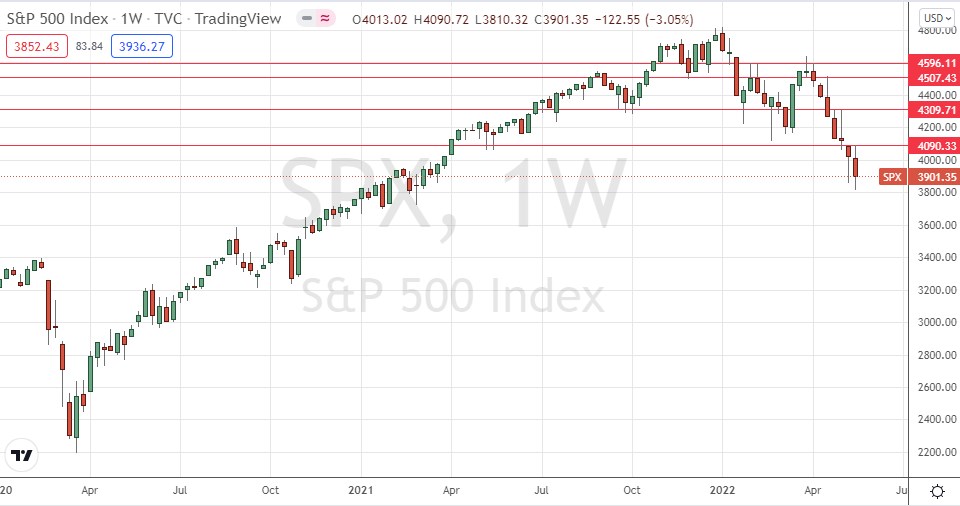
Stock markets are generally weak, but it should be noted that the S&P 500 Index was bought quickly the two times it fell close to or below its 20% decline level at 3,856. This suggests long-term buyers are stepping in at this technical bear market area. Buying the dips in the US stock market has been a great strategy in recent years, but there is certainly a strong downwards trend in US stocks which is supported by fundamental factors and monetary policy.
Cryptocurrencies continue to look very weak, but it is notable that Bitcoin buyers are stepping in when Bitcoin threatens to break down below $28,607. It should be said the price action is weak, and there remains a serious and immediate danger of strong falls in major cryptocurrencies. Short trades in cryptocurrencies will continue to attract speculators in this environment, while margin calls will force retail liquidations.
The Forex market is dominated by a sell-off in the US Dollar which does not quite fit into the risk-on / risk-off paradigm. Although the safe-haven Japanese Yen made a gain against the greenback last week, so did almost every other currency. The main factor driving the Forex market now is US Dollar weakness.
There is increasing hope that the coronavirus pandemic may be almost over, although rates of coronavirus infection globally rose last week for the first time in nine weeks. The only significant growths in new confirmed coronavirus cases overall right now are happening in Australia, Chile, the USA, Panama, Portugal, Trinidad, and Taiwan.
The Week Ahead: 23rd – 27th May 2022
The coming week in the markets is likely to be equally or more volatile than last week. There are a few releases of high importance scheduled. They are, in order of likely importance:
-
US Preliminary GDP data – this will be closely watched for evidence concerning whether the USA is falling into a recession. US GDP contracted by 1.4% last quarter and is expected to fall again in the current release. However, most analysts believe the US will avoid a recession in 2022, but if the data begins to show it will not, this could hit stock markets hard.
-
US FOMC Meeting Minutes – this will be analyzed for more clues as the Fed’s thinking on the pace of future rate hikes.
-
US Core PCE Price Index data – this will be analyzed for clues as to whether US CPI has peaked.
-
RBNZ Monetary Policy Statement and Official Cash Rate – the Reserve Bank of New Zealand is expected to hike its interest rate by 0.50% to 2.00%, which would be by far the highest rate applied to any major currency.
-
German Flash Services & Manufacturing PMI data.
Teknik Analiz
U.S. Dollar Index
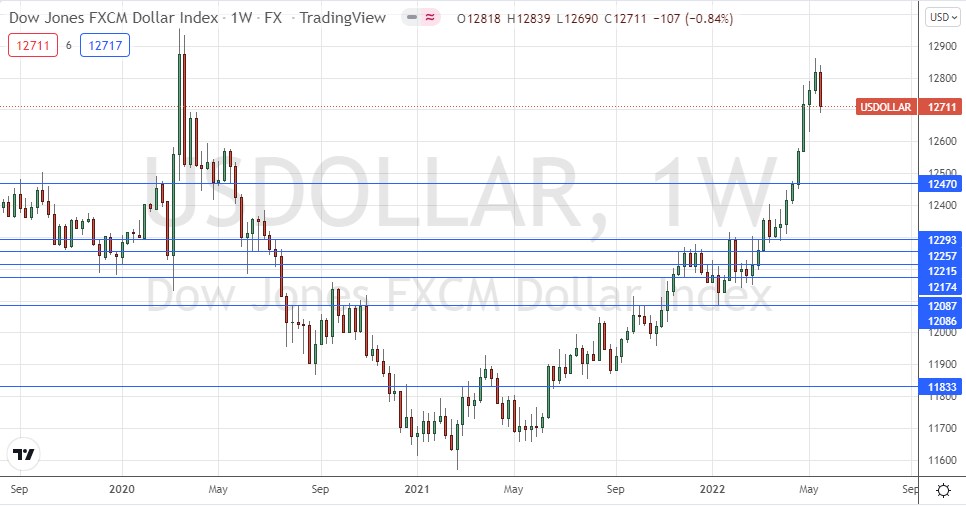
The weekly price chart below shows the U.S. Dollar Index fell last week, against the long-term bullish trend, printing a bearish engulfing bar that closed not far from the bottom of its range. This reversal is not very notable technically, apart from its location in the chart confluent with a long-term high, with reinforced the bearish case. In another sense it is very notable, as the Dollar had risen for the last eight consecutive weeks. This downwards move does not come as a complete surprise, as it had been clear that the pace of bullish momentum was declining.
Another notable feature in the Forex market this week was the selloff in the greenback against all other currencies, showing the market is currently being driven by US Dollar weakness.
Despite the long-term bullish trend, it will probably be a mistake to expect a rising Dollar over this coming week.

US Dollar Index Weekly Chart
S&P 500 Index
The world’s most important stock market index, the S&P 500 Index, fell again last week for the seventh consecutive week, and finally reached a 20% drop from its all-time high, signaling a formal bear market in this Index by any measure. There is a long-term bearish trend, which is showing quite healthy momentum. Last week’s closing price was the lowest in more than 14 months.
These are bearish signs and there are good reasons to be shorting major stock market indices now, especially this which is the biggest Index in the world. However, there are bullish signs to be aware of, such as the strong buying seen every time the price got close to or dipped below the 20% decline level at 3,856. On its last attempt, the price got well below this level, but rebounded very strongly and quickly to end the week above the round number at 3,900. This is suggestive of heavy buying, and if buyers keep stepping in at these levels, and we keep seeing days close above 3,900, the less likely a further major downwards move will become.
Trading major stock market indices short can be challenging, but experienced traders might want to be looking for short trades here.

S&P 500 Index Weekly Chart
BTC/USD
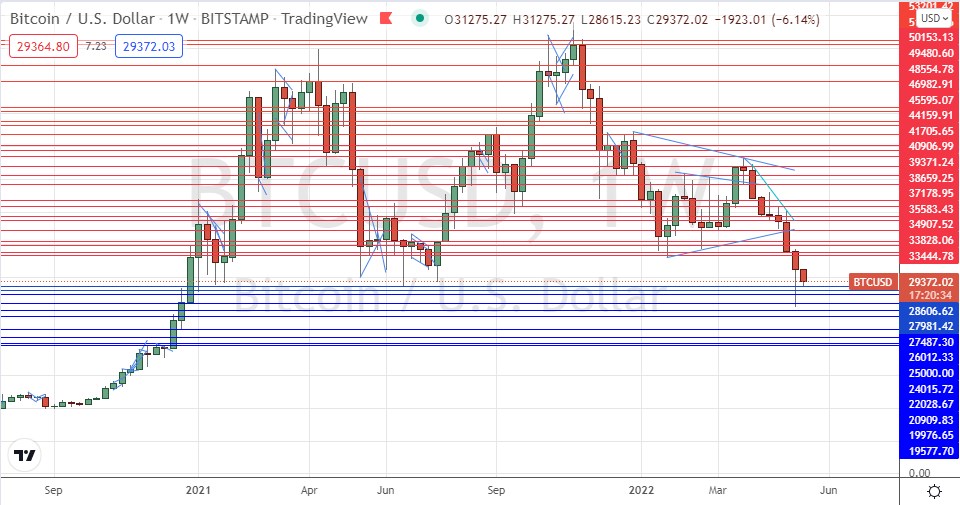
Bitcoin fell again last week in line with its long-term bearish trend, for the eighth consecutive week, just like the S&P 500 Index. The week ended with a close at a 17-month low and the printing of a bearish inside bar which closed very near the low of its range.
These are bearish signs, and there has been panic in the crypto sector due to the collapse of certain stablecoins such as Luna/Terra. This helps the bearish case.
However, crucially, the price remains very reluctant to make a daily close below the very pivotal support level at $28,607 – the price somehow keeps refusing to spend very long below that level, although the price has traded meaningfully lower. Over the past few days, this key support level has continued to survive tests from above.
Bitcoin is poised on the edge of an abyss, but we may see a long-term bullish rebound from this area. A key indicator is likely to be whether we get a daily close below this very pivotal point at $28,607.
I wrote something similar about Bitcoin last week, except I thought the key support level to use was a little higher, at $28,800. I am not discouraged by this as the price action continues to look bearish and heavy, and I continue to believe we are more likely to see a significant downwards movement in the price before we see any strong bullish rebound.
I will be happy to take a short trade once we get a daily closer lower than that level. However, I do note that the $28,607 survives the near future, it could become a long-term low and trigger a new advance.

BTC/USD Weekly Chart
Bottom Line
I see the best opportunities in the financial markets this week as likely to be:
- Short of the S&P 500 Index following a daily (New York) close below 3,900.
- Short of BTC/USD following a daily (New York) close below $28,606.

