More strong falls in value likely as EUR remains weakest currency.
My previous EUR/USD signal last Thursday could have produced a long trade from the support level I had identified at $1.0150, but this gave only a little more than 25 pips of profit. I did say I was not taking any long trades that day.
Today’s EUR/USD Signals
Risk 0.75%.
Trades may only be entered between 8am and 5pm London time today.
- Go short following a bearish price action reversal on the H1 timeframe immediately upon the next touch of $1.0053 or $1.0093.
- Place the stop loss 1 pip above the local swing high.
- Move the stop loss to break even once the trade is 20 pips in profit.
- Take off 50% of the position as profit when the price reaches 50 pips in profit and leave the remainder of the position to run.
Long Trade Ideas
- Go long following a bullish price action reversal on the H1 timeframe immediately upon the next touch of $1.0000, $0.9950, $0.9900, or $0.9850.
- Place the stop loss 1 pip below the local swing low.
- Move the stop loss to break even once the trade is 20 pips in profit.
- Take off 50% of the position as profit when the price reaches 20 pips in profit and leave the remainder of the position to run.
The best method to identify a classic “price action reversal” is for an hourly candle to close, such as a pin bar, a doji, an outside or even just an engulfing candle with a higher close. You can exploit these levels or zones by watching the price action that occurs at the given levels.
EUR/USD Analysis
In my last analysis of the EUR/USD currency pair on Thursday last week, I noted the particular weakness in the Euro and the strength in the USD, and predicted that the best approach here would remain looking for short trades.
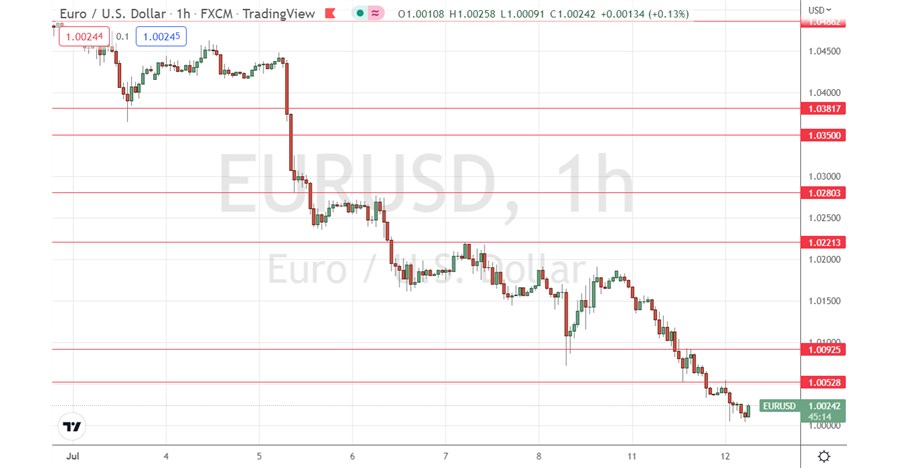
This was a good call, as the price not only fell over the day, but has continued to fall strongly ever since by more than 200 pips.
The technical picture is extremely bearish. Yesterday saw an above-average price move, which ended the day very close to its low, making yet another lowest daily close since 2002.
The price has continued to fall during today’s Asian session, and a few hours ago reached to within just 5 pips of the parity rate ($1.0000), which is extremely psychologically significant.
A look at the price chart below shows that the price has been falling very directly, with only a few minor pullbacks. This is another bearish sign.
The price is trading in “blue sky”- levels not reached in years – so should be able to continue to move down easily.
It is possible that there will be strong hand buying for the long-term below parity, or that banks will be defending large option barriers down there. However, there are no obvious support levels nearby. I can only guess at half and whole numbers as potential bullish reversal points.
The odds remain in favour of a further downwards move today, so give a potential short trade opportunity from pullbacks that then revert into the trend (especially in the $1.0050 area) but watch out for a bullish reversal at or below parity.

There is nothing of high importance scheduled today regarding either the EUR or the USD.
Ready to trade our daily Forex signals? Here’s a list of some of the best Forex brokers to check out.

