Ultimately, this is a market that I think you are still looking at as an opportunity to short on exhaustion.
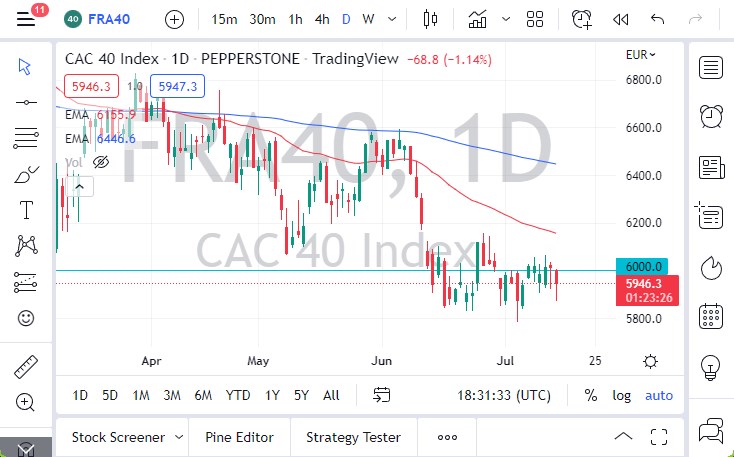
The French index plunged initially during the training session on Thursday to reach below the €5900 level but then turned around to show signs of life again. Ultimately, this is a market that I think continues to see a lot of noisy behavior, and it’s also obvious that the €6000 level continues to cause major issues. Alternatively, this is a market that looks as if it is trying to consolidate and find a bit of buying pressure, and if we can break above the 50 Day EMA, it’s likely that we could go higher.
The 50 Day EMA is sitting at the €6150 level, and could offer a bit of dynamic resistance. If we break above the €6200 level, then it’s possible that we could go much higher. If we do get that breakout, the 200 Day EMA would get targeted, which is sitting just above the €6400 level. After that, we have even more resistance at the €6600 level, which should offer resistance as well. Ultimately, once we break above that then you could have a major breakout and potentially even a major trend change.
Alternately, if we were to break down below the €5800 level, then it opens up the possibility of a significant breakdown, perhaps opening up the possibility of a major meltdown. Keep in mind that stock markets around the world continue to suffer, mainly due to the fact that the global economy looks as if it is going to continue to struggle. Furthermore, the market is likely to see that the inflationary issues will continue to be the biggest problem, and of course, France is going to suffer right along with the rest of these indices.
Looking at the start, it seems like we are going to see a lot of noisy back-and-forth type of action, and therefore it’s likely that the market continues to see a lot of huge moves, but perhaps based on short-term charts more than anything else. You should be cautious with your position size in this type of environment because even if we do continue to see a massive downtrend, the reality is that you will get the occasional bear market bounce that will rip the face off of the bears. Ultimately, this is a market that I think you are still looking at as an opportunity to short on exhaustion. Ready to trade our CAC analysis? Here are the best CFD brokers to choose from.


