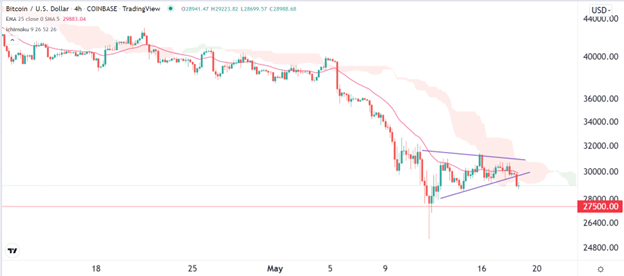
The pair will likely keep falling as bears target the next key support level at 27,500.
Bearish View
- Sell the BTC/USD pair and set a take-profit at 27,500.
- Add a stop-loss at 31,000.
- Timeline: 1 day.
Bullish View
- Set a buy-stop at 30,300 and a take-profit at 32,000.
- Add a stop-loss at 28,000.
The BTC/USD pair correlation with American stocks continued in the overnight session. Bitcoin declined to a low of $28,000, which was the lowest level since May 14th. It has declined by more than 7.50% below the highest level this week.
Bitcoin and Nasdaq 100 Correlation
The BTC/USD pair declined sharply as American stocks declined sharply. The Dow Jones declined by more than 800 points while the Nasdaq 100 and S&P 500 indices fell by more than 2%. This performance is a reflection that the correlation between these assets is continuing.
The most recent crash was caused by the most recent statement by Jerome Powell. In a statement on Tuesday, Powell said that the bank will do whatever it takes to lower inflation. This will involve reducing the bank’s balance sheet through the process of quantitative tightening. It will also involve aggressively raising interest rates.
Another reason for the sell-off was the ongoing margin pressure among American firms as the cost of doing business rises. On Tuesday, Walmart published weak earnings, which showed that the cost of products was rising.
Target, one of the biggest retailers, said that its logistics costs were rising. As a result, shares of most companies like Amazon, Kroger, and Apple declined sharply. Therefore, these risks helped to push cryptocurrencies sharply lower.
The performance of the BTC/USD pair was also a reflection that the recent rally was not strong enough. It is what is known as a relief rally or a dead cat bounce that happens after a major sell-off. Other cryptocurrencies like Ethereum, Ripple, and Avalanche also crashed hard.
Another reason for the sell-off is that there are simply not enough buyers amid the sell-off and that many holders have decided to exit their positions.
BTC/USD Forecast
The four-hour chart shows that the BTC/USD pair declined sharply during the American session. As it dropped, the price managed to move below the lower side of the bearish pennant pattern. It also moved below the 25-day and 50-day moving averages and the Ichimoku cloud. Also, oscillators like the Relative Strength Index (RSI) has tilted lower.
Therefore, the pair will likely keep falling as bears target the next key support level at 27,500. The stop-loss for this trade is at 30,500.


