Bullish view
- Buy the BTC/USD and set a take-profit at 32,000.
- Add a stop-loss at 28,368.
- Timeline: 1-2 days.
Bearish view
- Sell the BTC/USD and set a take-profit at 28,000.
- Add a stop-loss at 26,000.
The BTC/USD pair remained in the tight range where it has been in the past few weeks. Bitcoin is trading at 30,911, which is lower than this week’s high of $31,430. Its performance mirrors that of other cryptocurrencies.
Bitcoin stuck in a range
The BTC/USD pair declined on Monday and Tuesday after the SEC continued its crackdown on cryptocurrencies. The regulator is investigating Binance, the biggest cryptocurrency in the world for its BNB coin. According to media reports, the agency is questioning the company for selling the token without following the law.
Bitcoin is still consolidating after New York legislators passed a law banning Bitcoin mining. The new move is notable since most mining companies are now making losses considering that the cost of power has jumped sharply.
Meanwhile, data by Glassnode shows that most Bitcoin holders are now sitting on unrealized losses. Still, the report noted that there are signs that the bear market is close to ending. They cited the fact that profit multiples by miners have compressed while financial stress has increased. Historically, this is usually a sign that the bear market is capitulating.
Another sign that the bear market is nearing its end is the fact that the put-to-call ratio has remained below 0.70 for days. It has ended the uptrend that happened in the past few weeks. A ratio that is below 0.70 and falling is usually a bullish sign.
On a macro level, there is no major economic event scheduled today. The next key data to watch will be the upcoming US inflation data. Still, its impact on the BTC/USD pair will be relatively low.
BTC/USD forecast
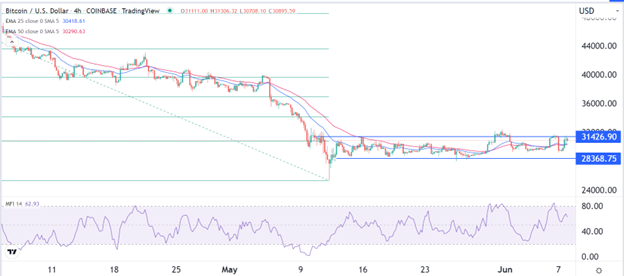
The four-hour chart shows that the BTC/USD pair has been in a narrow range in the past few days. The pair has moved between the key support and resistance level at 28,368 and 31,426. It is oscillating near the 25-day and 50-day moving averages.
Meanwhile, the Mayer Multiple has moved to the oversold level of 0.68. This is a common indicator that shows the ratio between price and the 200-day moving average. As such, it is a tool used to find the deviation from the long-term average price.
Another model known as the Realized Price Model, which is used to identify bottoms. This price is currently at $23,600, which signals the average cost of all BTC in circulation. This is a sign that Bitcoin is about to bottom.

