The market continues to see a lot of volatility, but it is clear that the buyers have stepped into the market and taken charge as of late.
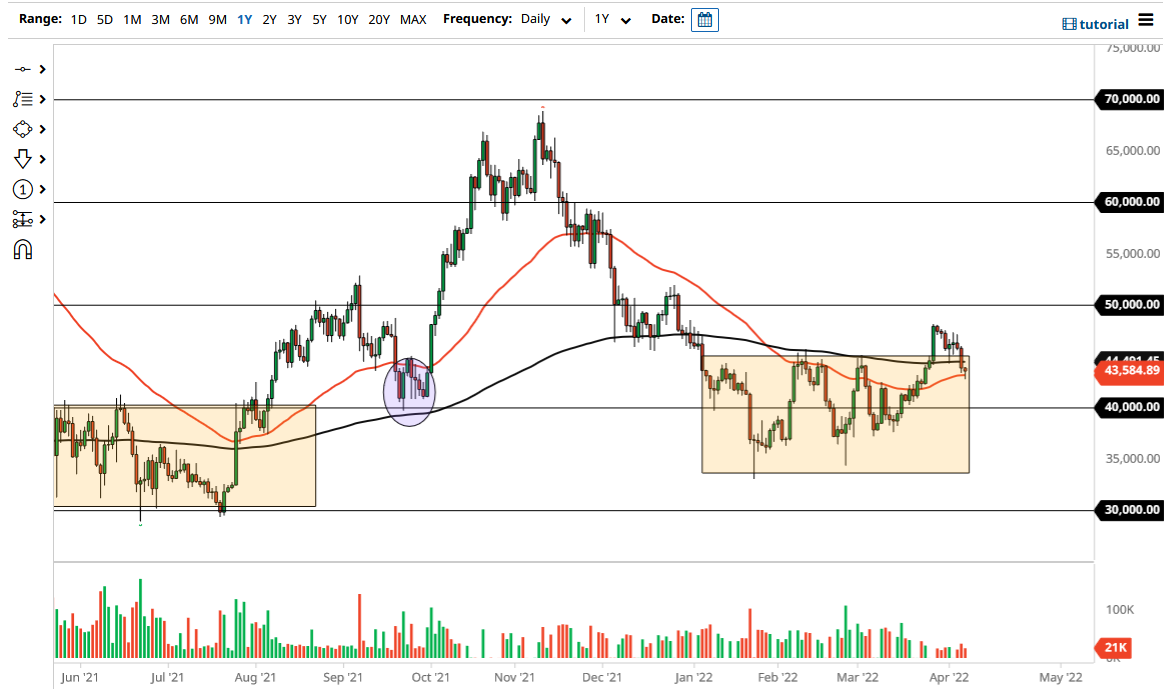
The Bitcoin market fell initially during trading on Thursday to reach the $43,600 level. The 50 Day EMA sits right there as well, so it did offer a little bit of technical support for the market. By doing so, the market turned around to form a bit of a hammer, which is a very bullish sign. It looks as if this is a sign that the market is trying to form a bit of a bottom after pulling back, and it is a bullish sign. This is likely to be the beginning of a significant attempt to turn things around, but we need to break above the 200 Day EMA to go long.
Looking at this chart, we had reached as high as $48,000 previously, and now it looks as if we are trying to get there based on the reaction on Thursday. Furthermore, you should pay close attention to monetary policy because we had initially fallen a bit during the Wednesday session as the Federal Reserve has released monetary policy meeting minutes that were much more hawkish than previously thought. That strengthened the US dollar and took a lot of risk out of the market, including in the Bitcoin market.
If we were to break down below the hammer from the trading session on Thursday, then it could open up a move down to the $40,000 level, an area that is a large, round, psychologically significant figure, and an area where we have seen a bit of action at previously. The market has been noisy recently, but when you look at the action over the last several months, we have formed a complex W pattern, and that quite often is a good sign. In fact, we even had a bit of a double bottom down at the $35,000 level.
If Bitcoin can rally from here, we will more likely than not retest the $40,000 level, before heading towards the $50,000 level. The $50,000 level has a certain amount of psychology attached to it and would more likely than not offer a barrier. If the market were to break above there, then it would be more or less a “buy-and-hold” type of situation. The market continues to see a lot of volatility, but it is clear that the buyers have stepped into the market and taken charge as of late.


