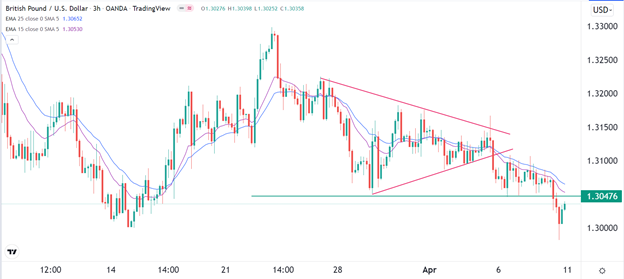
The pair will likely keep falling.
Bearish View
- Set a sell-stop at 1.300 and a take-profit at 1.2950.
- Add a stop-loss at 1.3100.
- Timeline: 1-2 days.
Bullish View
- Set a buy-stop at 1.3050 and a take-profit at 1.3100.
- Add a stop-loss at 1.300.
The GBP/USD crawled back slightly on Monday morning as investors position themselves for a busy week. The pair rose to a high of 1.3035, which was slightly higher than last week’s high of 1.2982.
UK and US Economic Data
The GBP/USD pair has been in a strong bearish trend in the past few weeks as investors worry about the ongoing market risks. The sell-off accelerated when the Federal Reserve published hawkish minutes. The minutes showed that the bank was committed to deliver more rate hikes and start a period of quantitative tightening.
This week, the focus will be on important economic data from the United States and the United Kingdom. On Monday morning, the Office of National Statistics (ONS) will publish the latest manufacturing and industrial production numbers. Economists expect the data to show that the two sectors rose slightly in February this year. The ONS will also publish the latest GDP numbers.
The next important numbers will come out on Tuesday when the UK will publish the latest employment numbers. Data published in March revealed that the UK unemployment rate declined to 3.9% while the economy has been adding more jobs. The key number to watch will be trends in wage growth.
The most important data from the UK will be the latest consumer price index (CPI) that are scheduled on Thursday. Economists expect the data to show that the country’s inflation rose from 6.2% in February to 6.7% in March. The core CPI, on the other hand, is expected to have risen from 5.2% to 5.4%. These numbers will provide signals of the next actions by the Bank of England.
The US will also release its inflation data on Wednesday. Economists expect that the country’s inflation jumped to a multi-decade high of 8.5% while core CPI rose from 6.4% to 6.6%.
GBP/USD Forecast
The GBP/USD pair managed to move below the symmetrical triangle pattern shown in pink. This was a sign that bears were taking over. The pair then managed to move below the important support at 1.3047, which was the lowest level on March 9th. It seems to be attempting to do a break and retest pattern, where it will retest this level.
The pair also moved below the 25-period and 15-period exponential moving averages. Therefore, the pair will likely keep falling. This will be confirmed if it moves below last week’s low at 1.2980.

