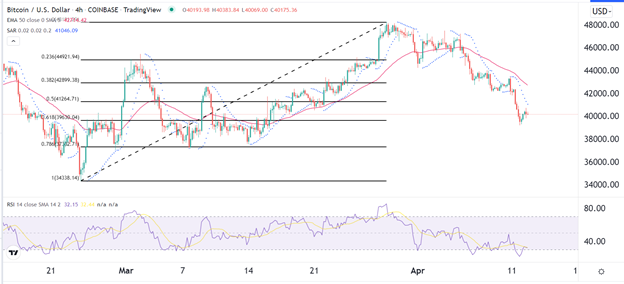
The pair will likely keep falling as bears target the key support at 38,000.
Bearish View
- Sell the BTC/USD pair and set a take-profit at 38,000.
- Add a stop-loss at 42,000.
- Timeline: 1-2 days.
Bullish View
- Set a buy-stop at 41,500 and a take-profit at 43,500.
- Add a stop-loss at 39,000.
The BTC/USD pair continued crawled back slightly even after the strong American consumer inflation data. It is hovering at the key support level of 40,000, which is substantially lower than this month’s high of near 48,000. It is also lower than its all-time high of almost 70,000.
Bitcoin Recovery Stalls
The BTC/USD pair has declined in the past few days after the US published strong inflation data. The headline data revealed that the country’s inflation rose to 8.5% in March, the highest it has been since the 1980s. Excluding the volatile food and energy prices, inflation rose by 6.5% in March.
On a month-on-month basis, inflation declined to 0.3%, the lowest level since August last year. The price action mirrored that of American stocks as the Nasdaq 100, Dow Jones, and S&P 500 indices rose by more than 1%.
This performance happened as investors predicted that the Fed will likely not be as aggressive as expected. Still, this small rebound could be a sign of a dead cat bounce considering that the latest inflation numbers were already baked in.
Meanwhile, on-chain data showed that investors used the recent rally to take some profits. At the same time, there have been limited inflow to Bitcoin and other digital currencies. As such, the market remains largely HODLer dominated as sentiment shifted from loss realization to modest profit-taking.
At the same time, activity in Bitcoin’s network has been a bit shaky in the past few days. According to Glassnode, the number of transactions per day has declined to about 225k. This is the same level of activity since the bear market that happened in 2019.
BTC/USD Forecast
The BTC/USD pair has been in a strong bearish trend in the past few weeks. As a result, the pair has managed to move below the 50% Fibonacci retracement level on the four-hour chart. The pair has also fallen below the 25-day and 50-day moving averages while the Relative Strength Index (RSI) has moved below the oversold level. The price has also dropped below the dots of the parabolic SAR.
Therefore, the pair will likely keep falling as bears target the key support at 38,000. On the flip side, a move above 42,000 will signal that there are still more buyers left in the market and invalidate the bearish view.


