We expect more rise for the index during its upcoming trading.
The Dow Jones Industrial Average returned to rise during its recent trading at the intraday levels, to achieve gains in its last sessions by 0.40%. It gained about 139.92 points, and settled at the end of trading at the level of 34,818.28, after its decline in trading on Thursday by -1.56%. During the past week, the index declined by -0.12%, breaking a series of gains that continued for two consecutive weeks.
Current volatility is making great stock trading opportunities – don’t miss out!
20 of the index’s 30 components were up, led by Verizon Communications Inc. by 2.32% and Visa Inc. by 2.07%, followed by Merck & Co. Inc. By 1.79%.
The US economy created about 431,000 jobs in March, and the unemployment rate fell to 3.6% from 3.8%. Economists polled by the Wall Street Journal had expected a total of 490,000 jobs in March, and a drop in the unemployment rate to 3.7% from 3.8%.
Hourly wages have risen sharply, pushing the increase in the past 12 months to 5.6%, the highest rate since the early 1980s. The Labor Department said employment in January and February combined was 95,000 higher than previously reported.
In other economic data, the final PMI reading for March was at 58.8, up from 57.3 in February. The improvement in the US manufacturing sector has been the sharpest overall and the sharpest since last September.
However the Institute for Supply Management’s manufacturing PMI, an indicator of US factory activity, fell to 57.1% in March from 58.6% the previous month, its lowest reading since September of 2020. The Wall Street Journal expected a slight improvement to 59% .
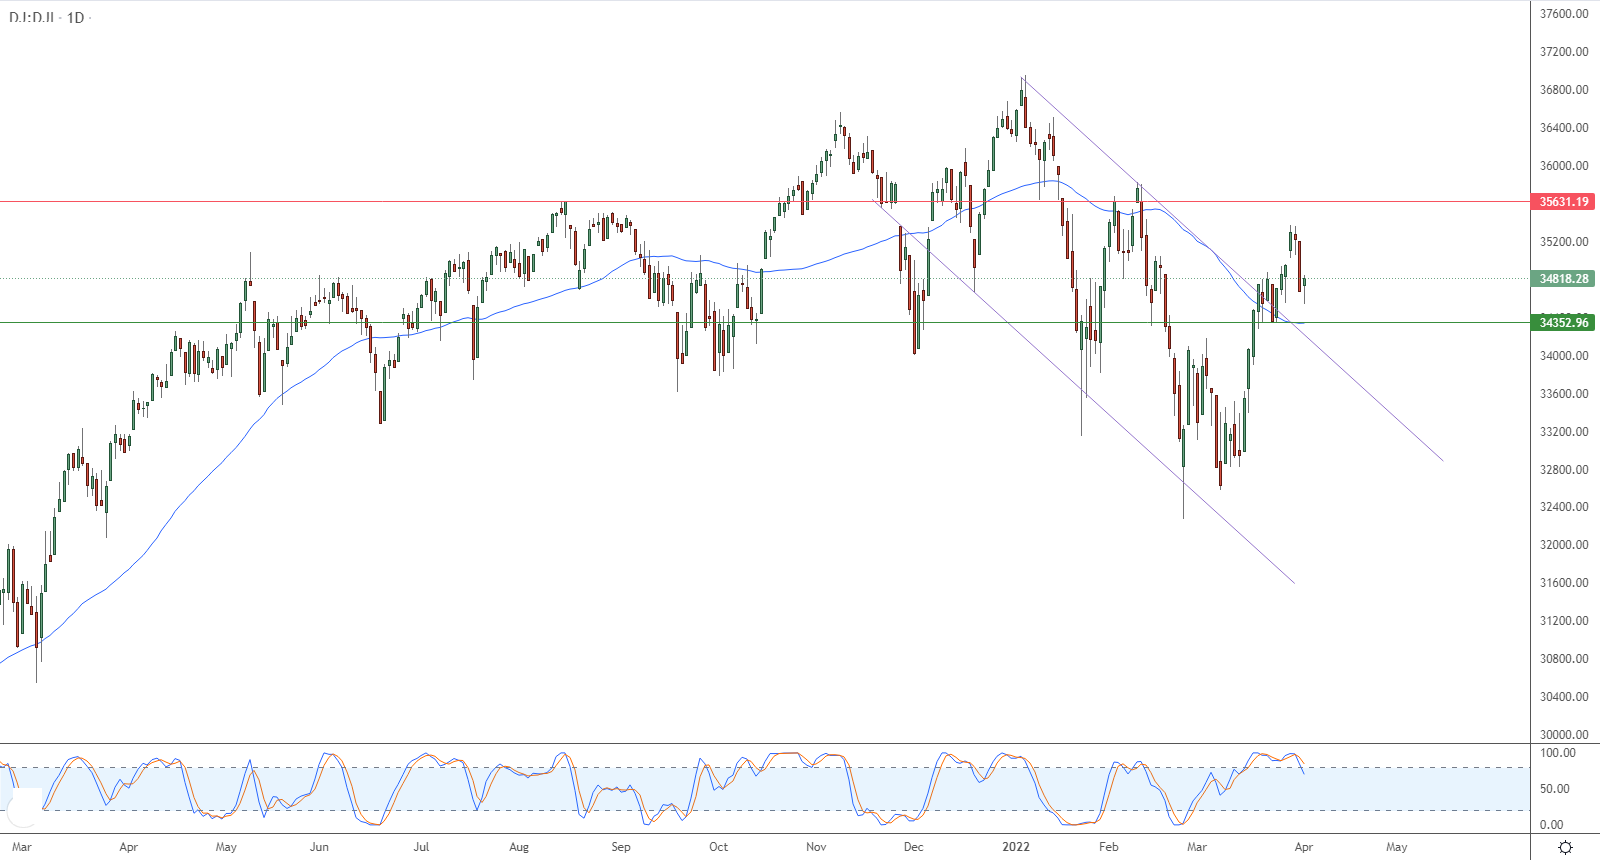
Technically, the index rose again despite its attempts to discharge its clear overbought by the relative strength indicators, and the influx of negative signals from them, which indicates the strength of the purchasing movement in the market, in light of the continued positive support for its trading above its simple moving average, and under its influence by leaving the range of a bearish corrective price channel that was It limits its previous trading in the short term, as shown in the attached chart for a period of time (daily).
That is why we expect more rise for the index during its upcoming trading, as long as support remains at 34,352.96, to target the first resistance levels at 35,631.19, in preparation for attacking it.


