Bitcoin (BTC) made news for its meteoric rise and its equally meteoric fall. But lately, outside of the news, Bitcoin is at an interesting technical point on a long-term chart. Let’s look.

Weekly Bitcoin Price Chart
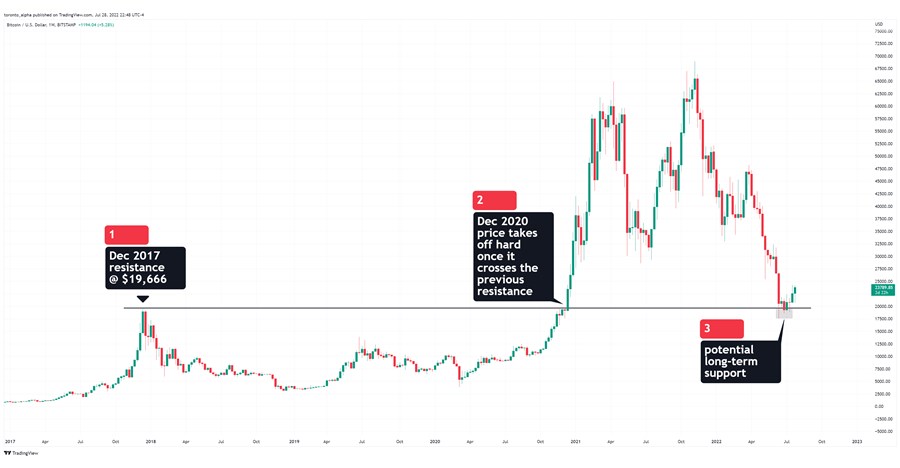
The BTC/USD currency pair made a key resistance level in December 2017 at $19,666. (I didn’t make up those last digits!) The price pulled back where it went sideways for three years. But when it did break through that level again, it showed huge momentum with historic gains not seen at that time in its history.
Fast forward after its all-time highs near $69,000 in November 2021, Bitcoin has fallen back to the resistance made in December 2017. But this time it is testing the level as a support. In Technical Analysis, this is known as “role reversal” where resistance turns into support. The reason this happens is that the sellers at a previous resistance become buyers when the level is reached again because they missed out on the previous move, thus creating support at the same level.
$19,666 is obviously a key level on the chart, and it’s already become a support level over the last few weeks. Because of the level’s historic significance, there’s a good chance it will hold and stall the fall in value.
Ready to trade BTC/USD? Here’s a list of some of the best crypto brokers to check out.

