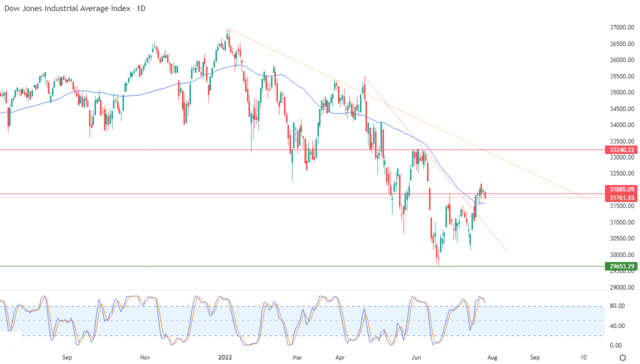
The Dow Jones Industrial Average declined during its recent trading at the intraday levels, to record losses in its last sessions, by -0.71%. It lost the index by -228.50 points and settled at the end of trading at the level of 31,761.55, after it rose during Monday’s trading by 0.28% .
Stocks opened lower after Walmart Inc. WMT late Monday forecast its earnings, saying that food inflation caused further cuts in apparel, dragging down other retail stocks as well.
The US Federal Reserve kicked off its two-day rate meeting Tuesday and Wednesday, which is expected to conclude Wednesday with a 75 basis point increase while the central bank continues to tighten aggressively in its efforts to curb inflation.
New home sales in the United States fell 8.1% to a seasonally adjusted 590,000 in June, from a revised 642,000 the previous month, the Commerce Department said Tuesday.
The S&P CoreLogic Case-Shiller 20 Index for 20 cities slowed to 20.5% year-over-year in May, down from 21.2% the previous month. A separate report from the Federal Housing Finance Agency also showed a monthly gain of 1.4%. Over the past year, the FHFA is up 18.3%.
The Conference Board’s decline in consumer confidence fell to 95.7 in July from a revised 98.4 in the previous month.
Dow Jones Technical Outlook
Technically, the index’s decline came as a result of the stability of the important resistance level 31,885, amid the dominance of the corrective bearish trend in the short term and its trading along a slope line. This is shown in the attached chart for a period of time (daily). The index benefits from support due to its trading above its simple moving average for a period of 50 from the previous day. It will try with this decline to gain positive momentum that might help it breach that resistance. In addition, it can try to drain some of its clear overbought by the relative strength indicators, especially with the start of negative signals from them.
Therefore, we expect the index to return to the upside during its upcoming trading, provided that it first breaches the resistance level 31,885, and then targets the resistance level 33,000.

Ready to trade the Dow Jones in Forex? Here’s a list of some of the best CFD brokers to check out.

