Start the week of April 3, 2022 with our Forex forecast focusing on major currency pairs here.
EUR/USD
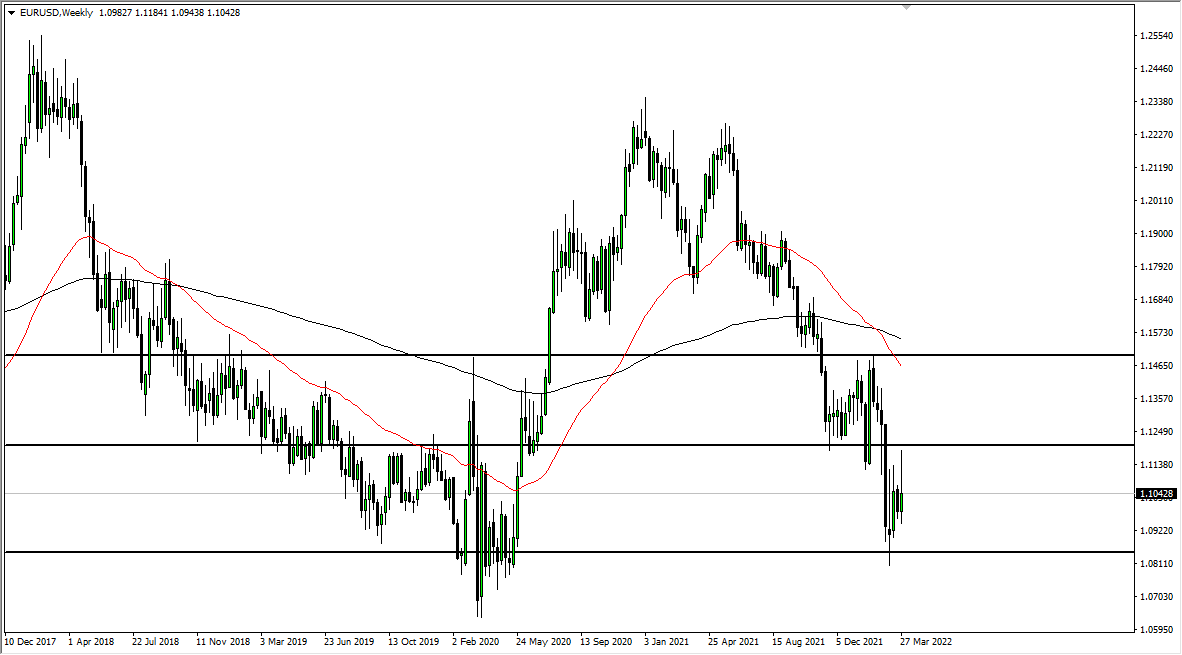
The euro spent most of the week trying to rally but as you can see, we have given back quite a bit of the gains. The 1.12 level above is a major resistance barrier, so it is not a huge surprise to see that we have pulled back from that region. By doing so, we ended up forming a shooting star and I think it is more likely than not that we will go looking towards the bottom of the overall range that extends down to the 1.0850 level. Looking at this chart, we are very much in a downtrend, and it looks as if we will continue as such.

GBP/JPY
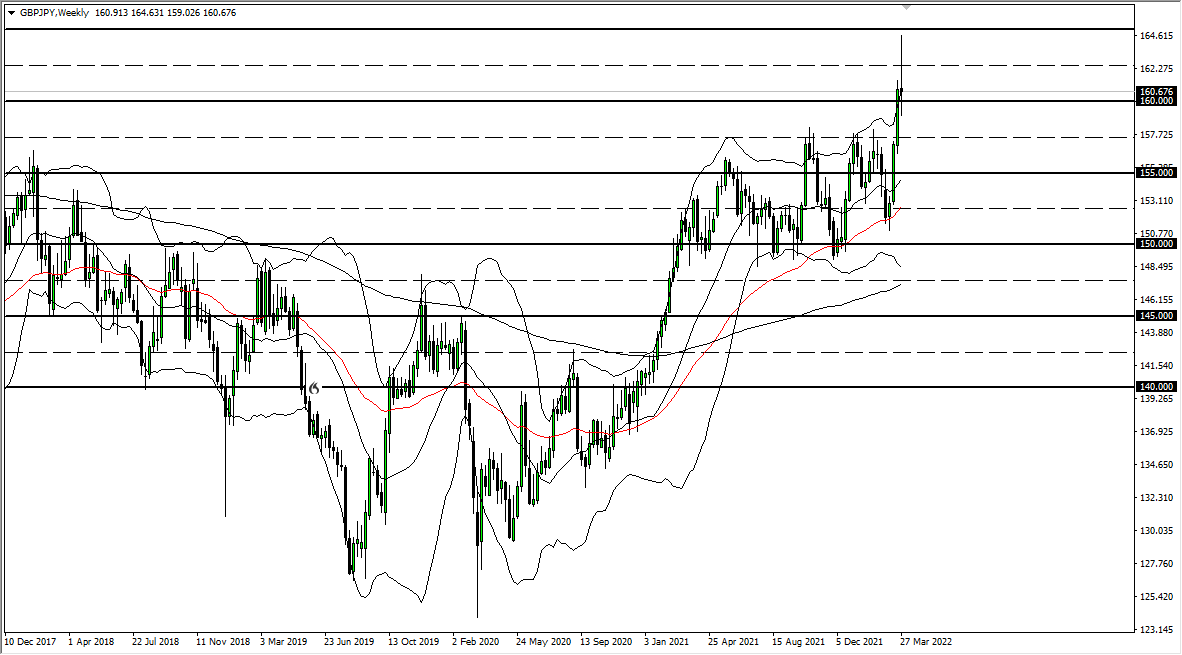
The British pound spiked against the Japanese yen last week, stretching almost all the way to the ¥165 level. At that point, the market then turned around to fall rather significantly and formed a massive shooting star. The shooting star has pierced the top of the Bollinger Band indicator, and therefore it would not be a huge surprise to see this market pull back toward the middle part of the band, near the ¥155 level.
Keep in mind that the pair is highly sensitive to the risk appetite of markets, as the Japanese yen is considered to be a “safer currency” to hold in times of turbulence. We have plenty of it out there.

AUD/USD
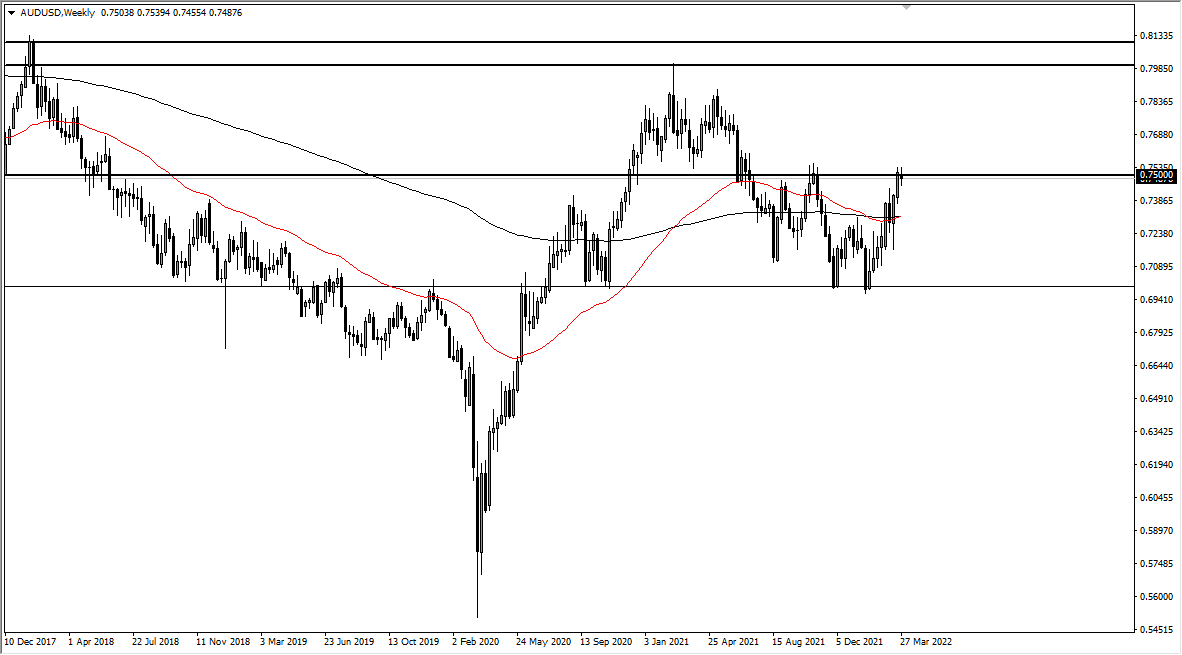
The Australian dollar failed at the same region that it has previously, namely the 0.75 handle. This suggests that the market is ready to fall, and if we break down below the bottom of the candlestick it could send this market down to the 0.7350 level. Breaking down below that level could then open up the possibility of the Australian dollar dropping to the 0.70 level over the longer term. That is an area that has been rather supportive more than once.

NZD/USD
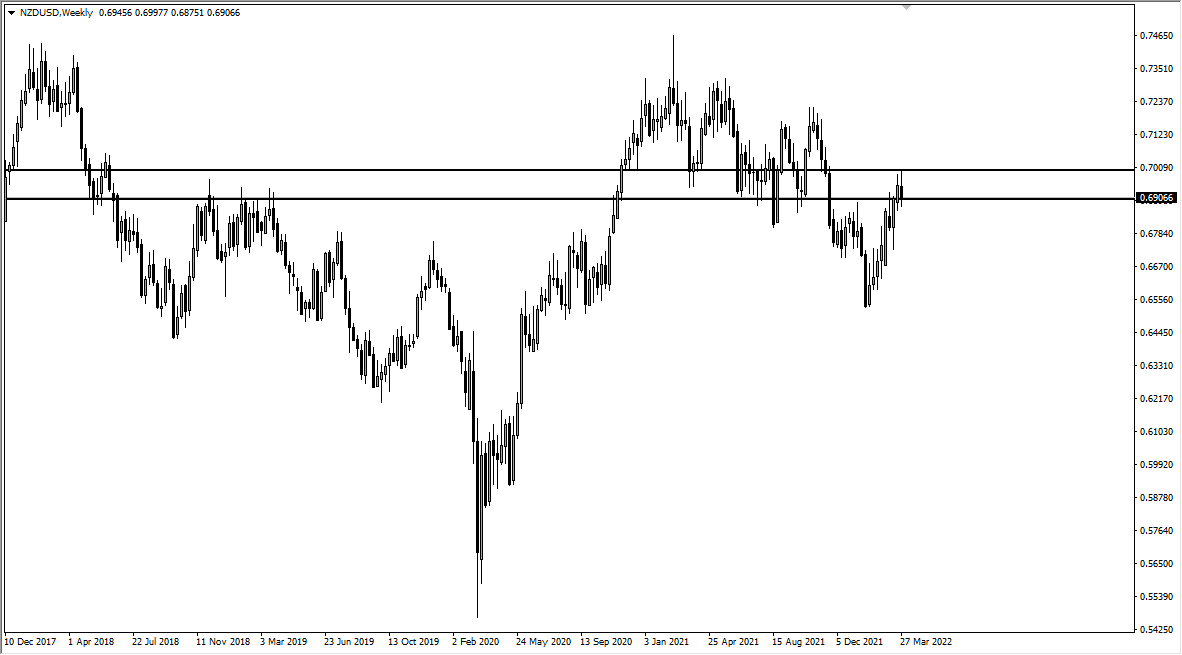
The New Zealand dollar initially tried to rally during the week but has run into a bit of resistance near the 0.70 level. By giving up those gains, we have formed a “two-week shooting star.” If we break down below the bottom of the candlesticks that make up the last two weeks, it is very possible we could drift towards the 0.76 handle, maybe even as low as the 0.65 handle over the longer term. This obviously would be a “risk-off” type of move.


