Start the week of August 8, 2022 with our #Forex forecast focusing on major currency pairs here.
EUR/USD
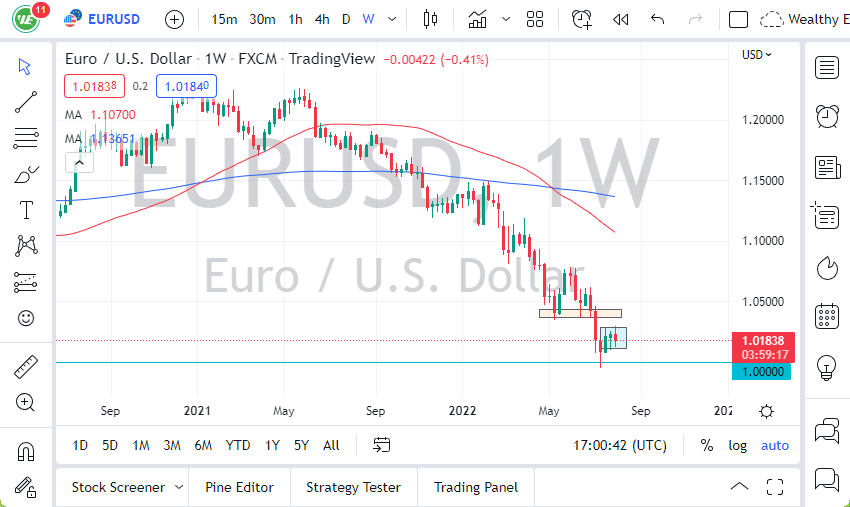
The EUR/USD currency pair went back and forth last week as we continue to see a significant amount of noisy behavior between the 1.01 level, and the 1.03 level. This is a scenario where we see a lot of choppy behavior, and I think that will continue to be the case. Going forward, this is all about fading short-term signs of exhaustion, but recognizing that we don’t have very far to go. If you break down below the 1.01 level, then it’s possible that we could go down to the parity handle.

GBP/USD
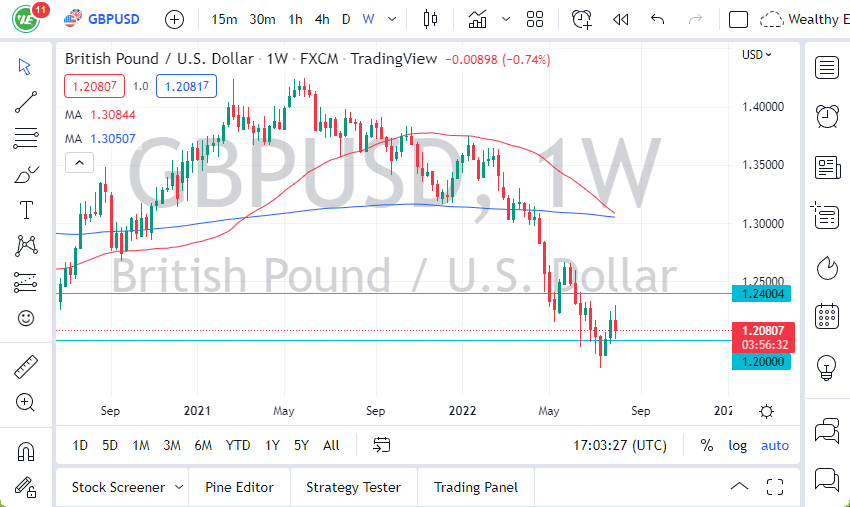
The GBP/USD currency pair initially rallied during the trading week but gave bank gains as we slammed into the 1.20 level. The 1.20 level is a significant support level, and it does look to me as if the market is trying to break through it. It’s also worth noting that the 50-week EMA is starting to break down below the 200-week EMA, thereby signifying just how negative things are. At this point in time, it’s worth noting that the interest rates in America spiked on Friday, that’s probably a potential catalyst for US dollar strength even further down the road. I prefer shorting signs of exhaustion after short-term rallies, as has been the case for a while.

AUD/USD
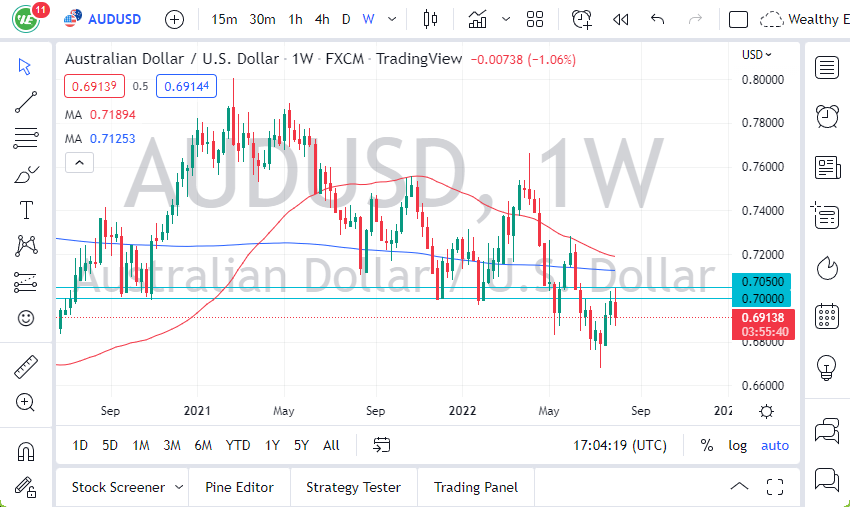
The AUD/USD currency pair tried to break above the 0.7050 level, an area that has been imported a couple of times now, so as long as we stay below there, I think it’s likely that we will continue the sellers on short-term rallies. By Friday, we have attested the 0.69 level, an area that has been imported more than once. If we break down below the bottom of the candlestick for the trading week, then it’s possible that the market is looking to the 0.68 handle, possibly the 0.67 level. Anything below 0.67 would be extraordinarily negative.
On the other hand, if we were to break above the 0.7050 level, then it’s possible that we could go looking to the 0.71 level, but that seems less likely now.

USD/JPY
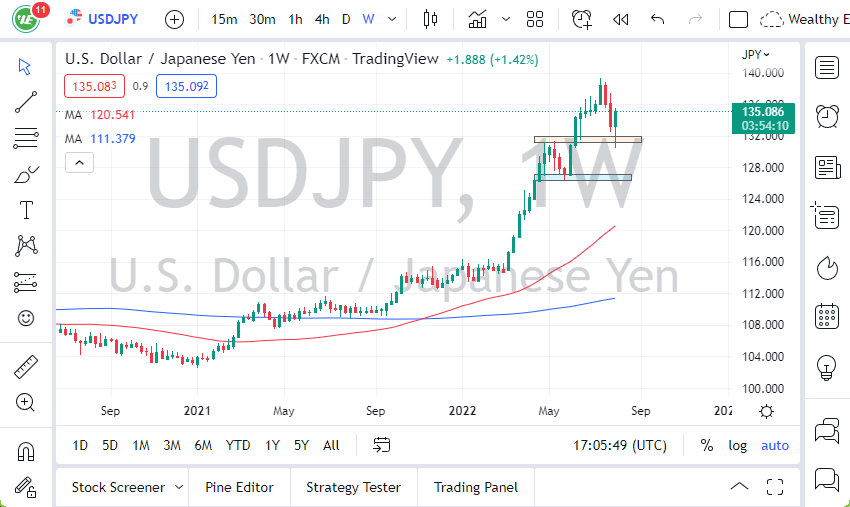
The USD/JPY currency pair fell initially during the trading week but then turned around near the ¥1.31 level to show signs of life. By the end of the week, we had spiked quite considerably and broke through some minor resistance as the interest rates in America have gone considerably higher. This remains a “buy on the dips” scenario.


